
Written by: Paul Foster, Founder, CEO, OnePlan
Key Takeaways for Permit-Ready Event Maps
- Most permit rejections happen when maps from PowerPoint, Canva, or Google Maps lack measurable scale, clear legends, and documented emergency access routes.
- City reviewers expect to-scale plans that show exact dimensions for entrances, fencing, stages, restrooms, first-aid stations, and a minimum 20-foot emergency vehicle access lane.
- A repeatable five-step process that uses geo-referenced site data, clear scale and legend standards, correctly placed safety elements, accurate counts and capacities, and high-resolution exports supports first-time approvals.
- Specialized mapping platforms reduce manual counting errors and version-control problems by generating automatic Bills of Quantities and keeping one live plan for every stakeholder.
- See how OnePlan creates export-ready, permit-compliant maps in minutes by booking a tailored walkthrough of the platform.
Why Permit Offices Require Accurate Event Safety Maps
Municipal permit offices across the United States require event site plans that reviewers can actually use. Boston, for example, requires a site plan or map to be submitted for outdoor public events. El Paso requires a site plan showing the location of vendors, stages, portable restrooms, emergency vehicle access, entrances and exits, fire protection, trash cans, and dumpsters. Grand Rapids requires a site map with specific dimensions noted for key elements such as tents and stages.
Non-scale maps drawn in everyday tools fail these checks because reviewers cannot verify whether a 20-foot emergency access lane actually fits, whether crowd areas are overcrowded, or whether fencing counts match what is shown. As the Cheese & Chilli Festival found: “With the software we were using before, the ability to scale wasn’t great. We couldn’t rely on it to be accurate and we would often get to site and have to make changes to layout due to plans not being to scale.”
Incomplete or non-scale submissions cause last-minute rejections, extra site visits, and delayed approvals. A repeatable, to-scale process eliminates those problems. Before diving into that process, you need to know exactly which elements your permit office expects to see on the map.
Event Safety Map Element Checklist for Permit Review
Before starting, confirm which of these elements your local authority requires. Most U.S. city permit offices expect the majority of the following:
- All entrances and exits, labeled with dimensions
- Perimeter fencing and internal crowd barriers, with linear footage noted
- An unobstructed emergency vehicle access route at least 20 feet wide (verify your local requirement)
- Stages and tents with dimensions labeled
- First-aid and medical stations
- Portable restrooms, with count noted
- Generators and temporary power locations
- Food and beverage vendor areas
- Signage locations
- Parking and vehicle access points
- North arrow
- Graphic scale bar (preferred over a text ratio, since printed maps can be resized)
- Legend explaining every symbol used
- Title block with event name, date, site address, preparer name, and revision date
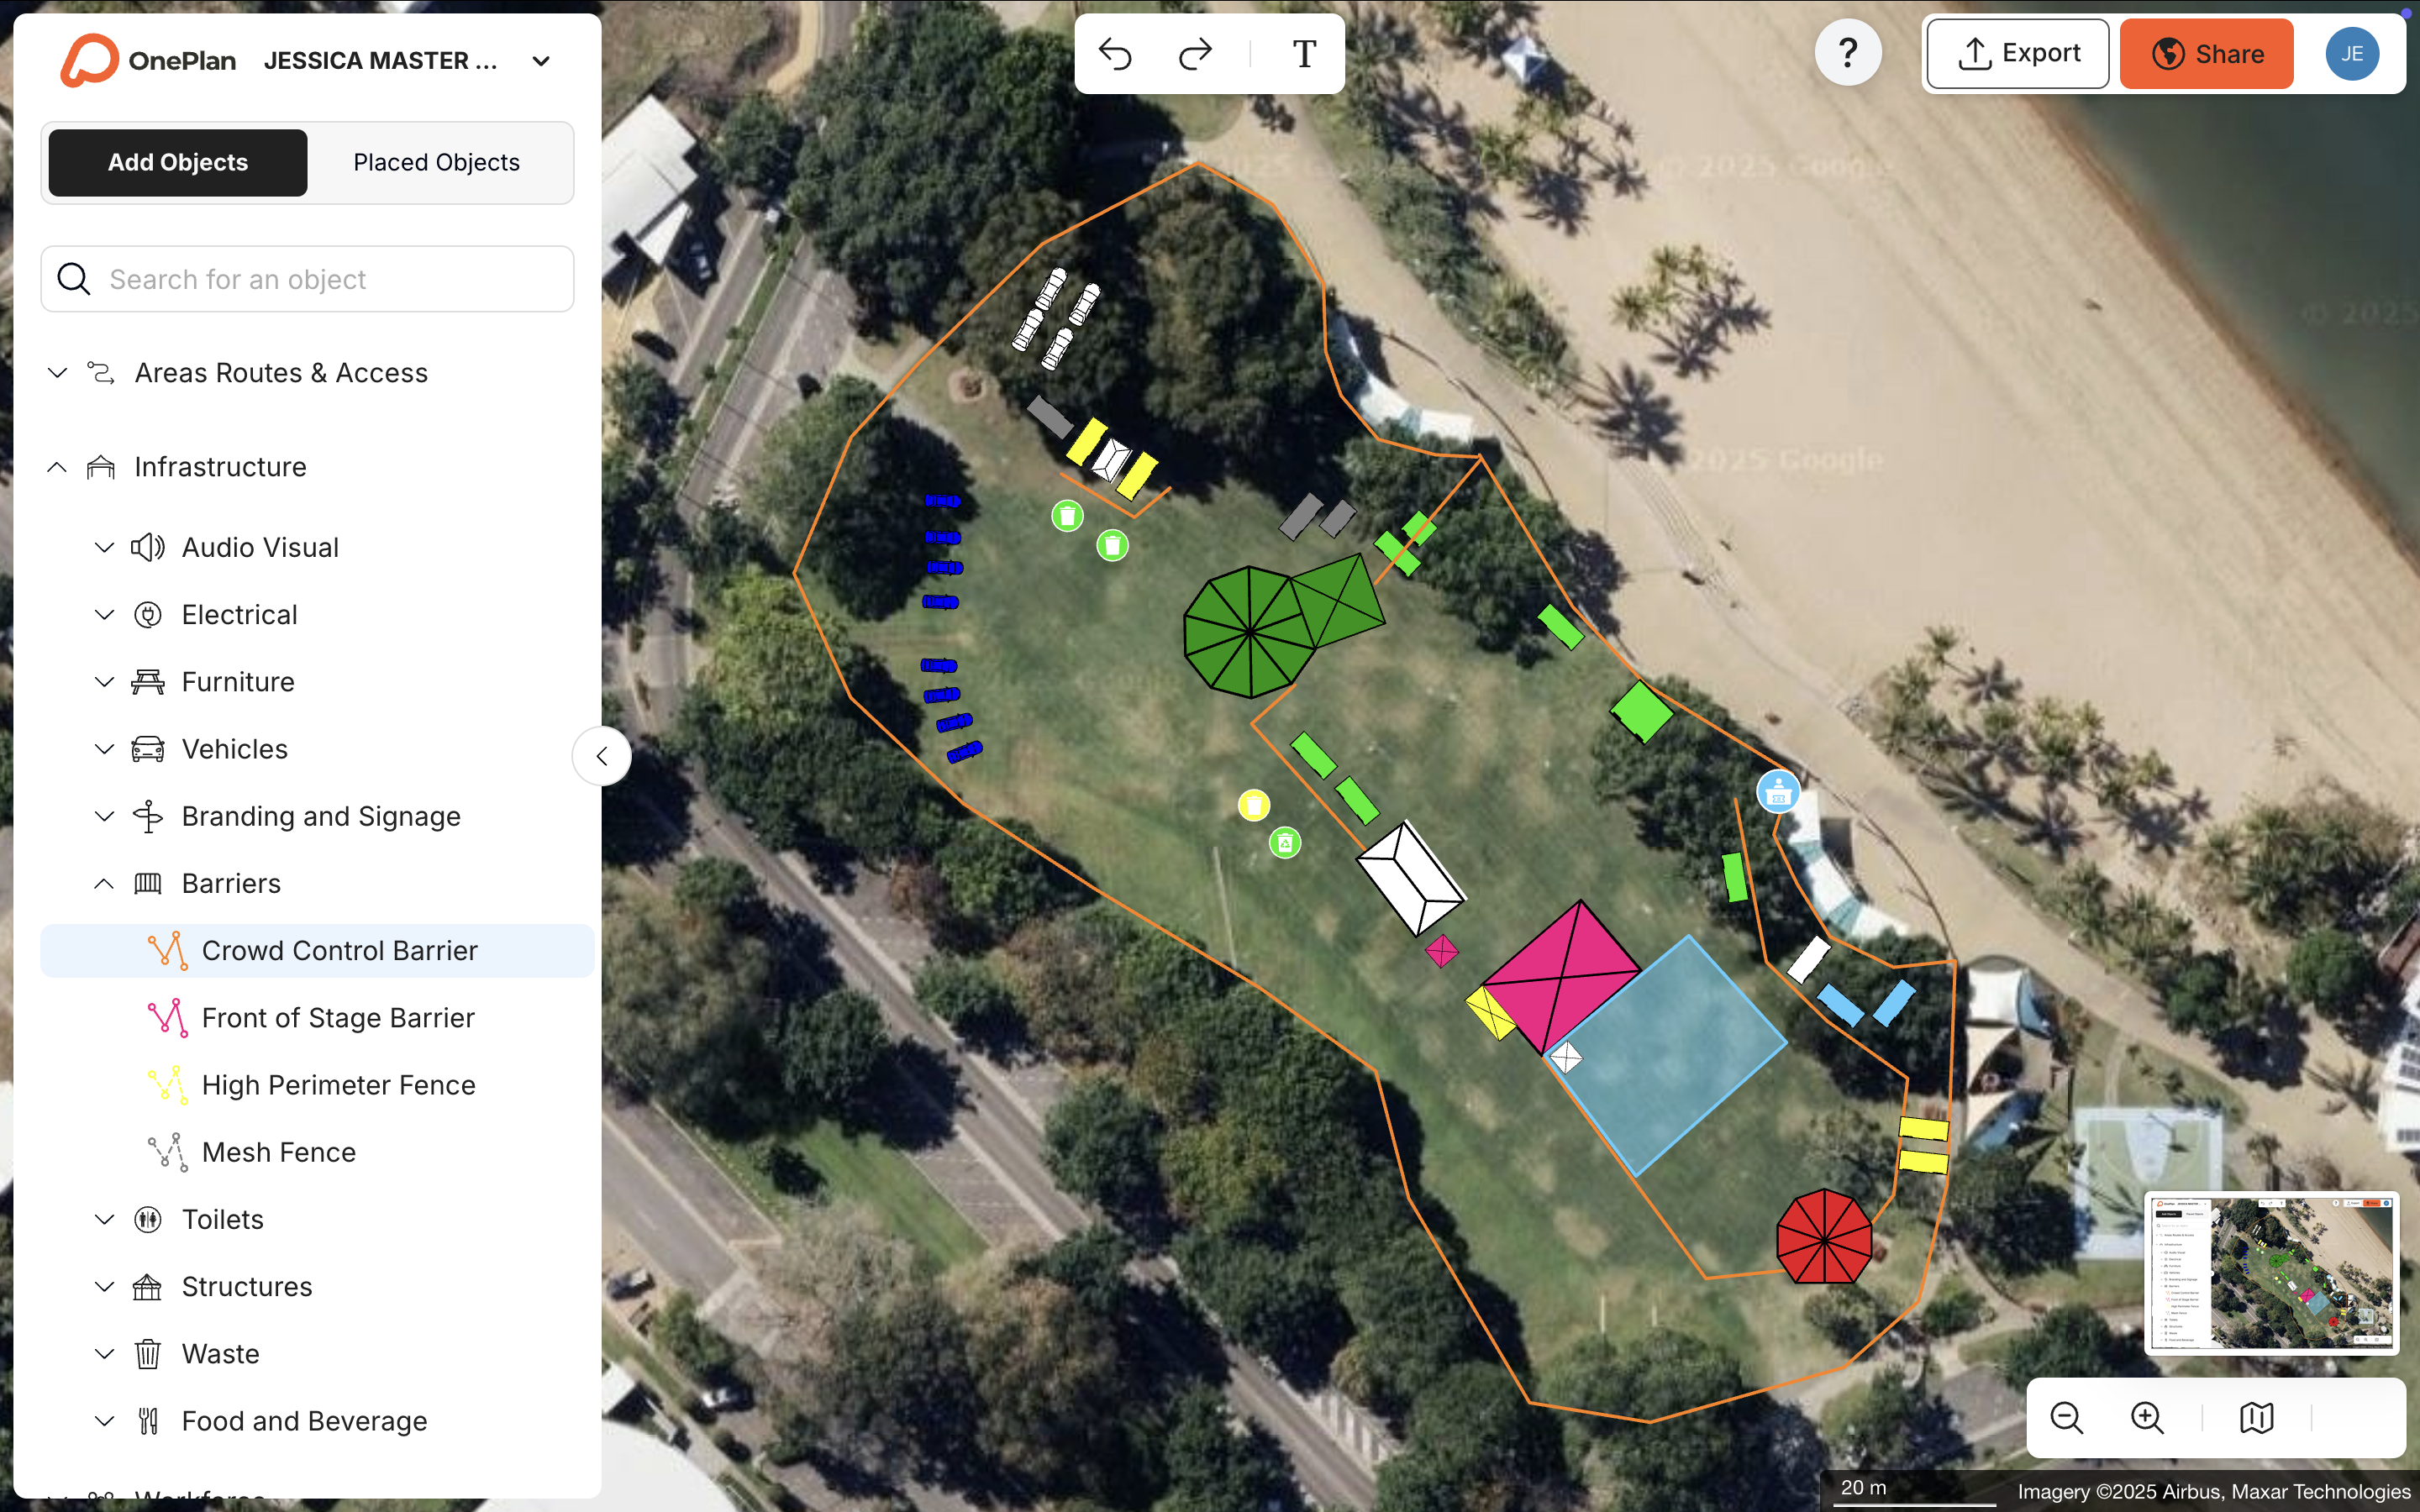
Step 1: Gather Site Data and Build a Reliable Base Map
Objective: Establish an accurate, geo-referenced foundation before placing any event infrastructure.
Inputs needed: Current satellite or street map imagery of the venue, any existing site plans or floor plans converted to .png for import, confirmed site boundaries, and access road locations.
Common mistakes that cause rejection: Using an outdated Google Earth screenshot as the base map, which may not reflect recent construction or road changes. South Fayette Township’s parks and recreation team switched from Google Earth to OnePlan specifically because the imagery was more current. Starting from a non-geo-referenced image means nothing on the plan is measurably accurate, which is a leading cause of permit rejection.
Step 2: Set Scale, North Arrow, and Legend Standards
Objective: Make every element on the map measurable and easy for a permit reviewer to interpret.
Inputs needed: A confirmed map scale appropriate to the site size, such as 1″ = 20′ or 1″ = 30′ for smaller sites, and 1″ = 40′ or 1″ = 50′ for larger sites. You also need a north arrow and a complete legend that covers every symbol type used on the plan.
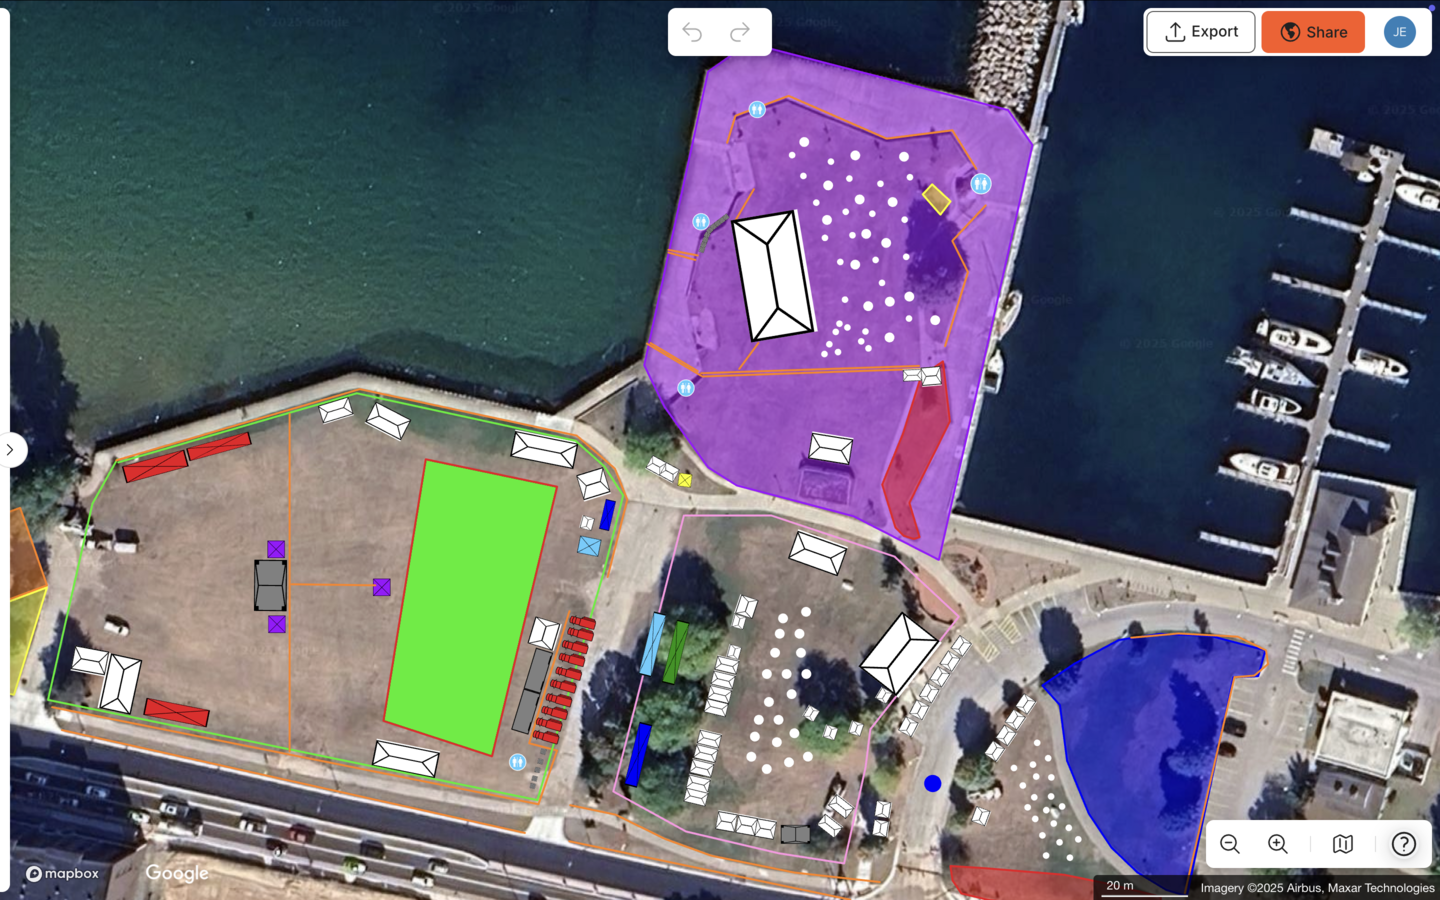
Common mistakes that cause rejection: Using a text ratio such as 1:24,000 instead of a graphical scale bar creates a measurement problem, because digital maps printed at varying sizes render a text ratio inaccurate, while a graphical bar scales with the document. This same focus on reviewer usability applies to legends. Omitting the legend entirely, or using symbols that are not defined, forces reviewers to guess, which often triggers revision requests. Finally, even a complete legend fails if the text is too small to read. All text on site plans must be legible at printed size, with a minimum 8-point font for labels and 10-point font for dimensions.
Step 3: Place and Label Required Safety Elements
Objective: Show all safety-critical infrastructure in its correct, to-scale position so reviewers can verify compliance without a site visit.
Inputs needed: Confirmed locations for emergency access routes, fencing lines, first-aid stations, crowd areas, and all signage. For events in California, for example, the California Fire Code sets a minimum 20-foot clear travel lane for fire access roads. Always verify the applicable standard with your local Authority Having Jurisdiction.
Reviewers frequently reject plans that show emergency access routes that are too narrow or fail to show turning radii for fire apparatus. Some cities specify fire lane dimensions and clearances during street closures, which must appear on the plan. Placing fencing or vendor structures that block fire hydrant clearances is another frequent rejection trigger, so check your local fire code for specific clearance distances and label them clearly.
Step 4: Document Infrastructure Quantities and Crowd Capacities
Objective: Produce defensible, documented counts of every infrastructure item and a verified crowd capacity figure for each designated area.
Inputs needed: Confirmed dimensions of all crowd areas, fencing runs, and tent footprints. Crowd capacity calculations should follow the standing density appropriate for your event type and local guidance. You can use OnePlan’s arrival and exit calculators to outline any area and instantly return a capacity figure based on a selectable people-per-square-meter density.
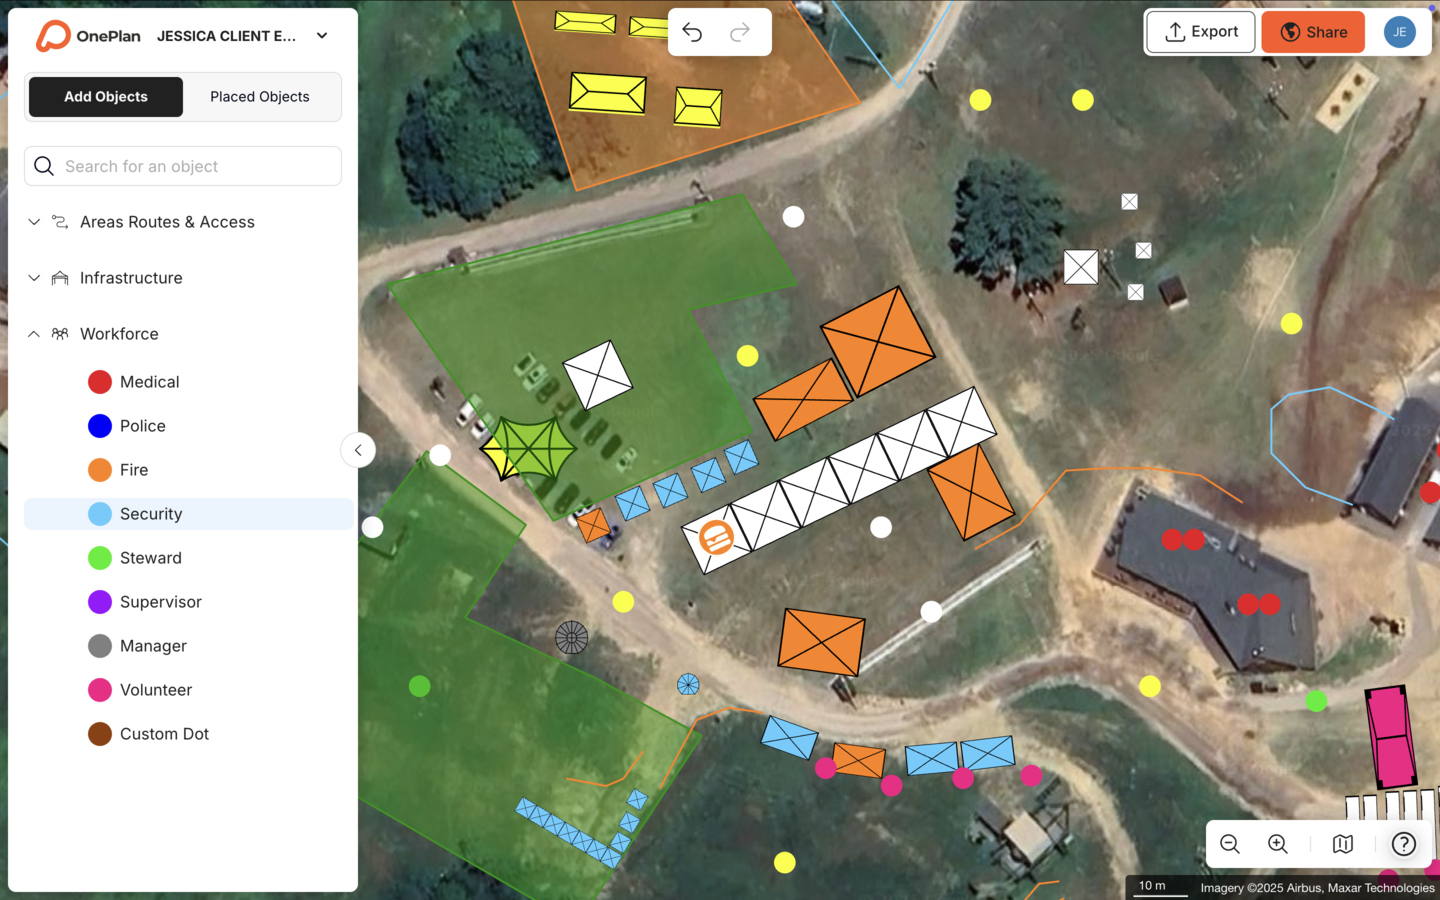
Common mistakes that cause rejection: Estimating infrastructure quantities by eye rather than measuring from the plan, which leads to under-ordered fencing and mismatched counts between the site plan and the permit application narrative. The Beirut Marathon’s race director notes: “One of the features I like most right now is the crowd measurement feature. It’s so helpful to measure how many people you’re going to fit in a small area.” Reviewers compare the plan against the application as a standard step, and they treat discrepancies between stated quantities and what is drawn as incomplete documentation.
Step 5: Export High-Resolution Maps and Supporting Reports
Objective: Deliver print-ready, high-resolution map files and an accurate infrastructure inventory that you can submit directly to the permit office.
Inputs needed: A finalized, reviewed plan with all elements confirmed. Export formats should match the permit office’s requirements. Most U.S. cities accept PDF or high-resolution image files, and some specify minimum paper sizes such as 11″ × 17″ or larger.
Common mistakes that cause rejection: Exporting at low resolution, which makes dimensions illegible at print size. Submitting a plan without a revision date in the title block, so reviewers cannot confirm they are looking at the current version. The North Texas Tribute Jam found that sharing detailed OnePlan maps with the City of Lewisville’s Health and Safety Department meant getting “the necessary approvals quickly and without headaches.”
Tools Comparison: Manual Methods vs. Specialized Mapping Platforms
| Dimension | Manual tools (PowerPoint, Canva, Google Maps screenshots) | Specialized mapping platforms (e.g., OnePlan) |
|---|---|---|
| Scale accuracy | Not to scale, so reviewers cannot verify dimensions | Every object stays to scale on a live geo-referenced map at any zoom level |
| Emergency access documentation | Drawn by eye, so widths are estimates rather than measurements | Measured and labeled from the map, and turning radii can be verified |
| Infrastructure quantity export | Manual count from a static image, which is error-prone | Auto-generated Bill of Quantities that exports every object as a structured inventory |
| Collaboration and version control | Files emailed back and forth, which often causes version chaos | Real-time collaboration on one live plan, so stakeholders always see the current version |
The Cheese & Chilli Festival’s organizer summarizes the difference: “Using OnePlan I create accurate, detailed and professional-looking event site plans without the need for a complex CAD package.” Mosaic, which plans large-scale charity events, reports a similar experience. “OnePlan makes planning easier, quicker, and more accurate. It definitely saves time and is less expensive than contracting a CAD designer.”
Common Event Mapping Challenges and How to Avoid Them
Version-control issues. When site plans are emailed as static files, different departments such as operations, security, fire, and the permit office often work from different versions. A single live plan that all stakeholders access from one source removes confusion about which file is current.
Under-estimated fencing counts. Fencing runs drawn by eye on a non-scale map routinely undercount the linear footage needed. When the Bill of Quantities does not match the plan, permit reviewers flag the discrepancy. Measuring fencing lines directly on a to-scale map and letting the platform calculate the count removes this error. SoulFest used OnePlan’s Bill of Quantities reports to order the right amount of fencing and infrastructure, cutting planning from two weeks to under a week.
Missing emergency vehicle turning radii. Showing a 20-foot-wide access lane is necessary but not sufficient if the lane does not provide adequate turning clearance for fire apparatus. Under the International Fire Code, the required turning radius is determined by the Authority Having Jurisdiction, so confirm the local specification and document it on the plan with labeled dimensions.
Measurable Results from To-Scale Event Mapping
Teams that move from manual tools to a repeatable, to-scale mapping process typically see measurable improvements across four areas:
- Fewer permit revisions. Accurate scale, complete legends, and documented emergency access reduce the back-and-forth with permit offices. Eagle Mountain City reduced planning time from 8–10 hours to a few hours per event and reported a 5x ROI after switching to OnePlan.
- Reduced site visits. Remote, to-scale planning means layout decisions can be validated from the desk before committing boots on the ground. The Beirut Marathon cut approximately 20 site visits per year down to one or two.
- Faster stakeholder sign-off. A single, professional, export-ready map shared with all departments replaces the cycle of separate maps for fire, police, and operations. Eagle Mountain City saw the 5x ROI and time savings mentioned earlier, along with another benefit: eliminating the need to create separate layouts for fire, police, facilities, and other departments.
- Consistent reuse of map templates year to year. A saved, to-scale base map of a recurring venue means next year’s plan starts from an accurate foundation rather than a blank canvas, which compresses the entire production timeline.
Frequently Asked Questions
How far in advance should I submit an event safety map for a city permit?
Lead times vary significantly by city and event size. Minor community events at the local level often require submission four to eight weeks in advance, while larger events involving road closures, alcohol service, or significant crowd capacity may require 90 days or more. Some cities require a finalized emergency plan 30 days before the event even if the initial application was submitted earlier. Always check with your local permitting authority for the specific timeline that applies to your event type and jurisdiction.
Who needs to review and approve the event safety map before it is submitted?
Internally, the map should be reviewed by everyone responsible for a section of the site, including operations, security, medical, and any vendor or contractor whose infrastructure appears on the plan. Externally, depending on the jurisdiction and event type, reviewers may include the fire marshal, police department, public works, parks and recreation, and a health and safety officer. Submitting a map that has already been reviewed internally reduces the number of revision cycles with the permit office.
What happens if the site layout changes after the permit has been submitted?
Most permit offices require notification of material changes to an approved site plan, and some require a revised submission. Version control therefore matters. A to-scale, live plan makes it straightforward to update a layout, export a revised map with a new revision date in the title block, and resubmit quickly. Keeping a single source of truth means the revised plan reflects every change across all departments at the same time.
Can OnePlan be used for indoor or multi-level venues, not just outdoor events?
Yes. OnePlan supports both outdoor sites and indoor spaces, including multi-level venues where you can plan across floors. You can import existing floor plans converted to .png, scale them onto the map, and plan on top of them. This approach works well for stadiums, arenas, and conference centers that need operational and spatial planning across multiple levels. OnePlan focuses on 2D operational planning, such as where infrastructure, staff, and crowds go, rather than 3D interior visualization.
Does OnePlan produce the Bill of Quantities automatically?
Yes. Every object placed on the map is automatically saved to a back-end inventory. The Bill of Quantities exports to Excel or CSV as a structured list that includes item counts, dimensions, and quantities, so drawing a fencing run on the map tells you exactly how many segments to order. This report can accompany the site plan submission to support permit applications and contractor coordination.
How does OnePlan handle crowd capacity calculations for permit documentation?
OnePlan’s crowd capacity calculator lets you outline any standing crowd area on the map and instantly return a capacity figure based on a selectable people-per-square-meter density. This produces a documented, defensible capacity figure for each zone that you can include in permit submissions. OnePlan calculates standing crowd capacity only. For arrival and exit flow planning, OnePlan also offers free calculators at calculators.oneplan.io/arrival and calculators.oneplan.io/exit/calculator.
Conclusion: Turning Event Maps into Permit-Ready Documents
A permit-compliant event safety map functions as a technical document that reviewers use to verify emergency access, infrastructure placement, crowd capacity, and site dimensions. Maps built in PowerPoint, Excel, Canva, Photoshop, Google Maps, or static screenshots fail that test because reviewers cannot measure them. The five-step process described above, which uses accurate site data, clear scale and legend standards, correctly placed safety elements with documented clearances, measured infrastructure quantities and crowd capacities, and high-resolution print-ready files, produces maps that pass review the first time.
OnePlan is built for this workflow. Teams drag and drop to-scale objects onto a live satellite or street map, use the crowd capacity calculator to document standing capacities for each zone, generate an automatic Bill of Quantities for every item on the plan, and export print-ready, high-resolution maps for permit submissions, all without CAD software or an engineering background. OnePlan has powered more than 200,000 events in 150 countries, from community festivals to the Paris 2024 Olympic Games.