
Written by: Paul Foster, Founder, CEO, OnePlan
Key Takeaways for Market Infrastructure Planning
- Manual spreadsheets and static maps often cause costly miscalculations, including wrong fencing lengths and inadequate toilet counts that trigger permit failures and budget overruns.
- Accurate site planning starts by importing or drawing the market footprint on a live satellite map so perimeter and area measurements update automatically.
- Breaking the site into functional zones such as vendor areas, aisles, and stages, then applying crowd-capacity calculators, keeps infrastructure quantities aligned with real attendance and usable space.
- Placing fencing, barriers, and portable toilets directly on the map feeds an auto-updating Bill of Quantities that removes manual counting errors and supports permit-ready documentation.
- OnePlan replaces guesswork with precise, map-based calculations, and you can book a demo to see how the platform streamlines infrastructure planning for your next market or festival.
Step 1: Draw Your Market Footprint on a Live Satellite Map
Accurate infrastructure calculations depend on an accurate site boundary. In OnePlan, the planning canvas is a live, zoomable satellite map, not a screenshot in a slide deck. Every object you place stays to scale at any zoom level, so a 10-foot fence panel remains 10 feet and a 20-by-20-foot vendor tent remains 20 by 20 feet.
First, navigate to your market site on the map. Draw your perimeter directly on the satellite image using the area and perimeter tool, or import an existing site plan. Convert the plan to a .png file, scale it onto the map, and build on top of it. In both cases, OnePlan returns the exact perimeter length and total area of your footprint as soon as you close the shape.
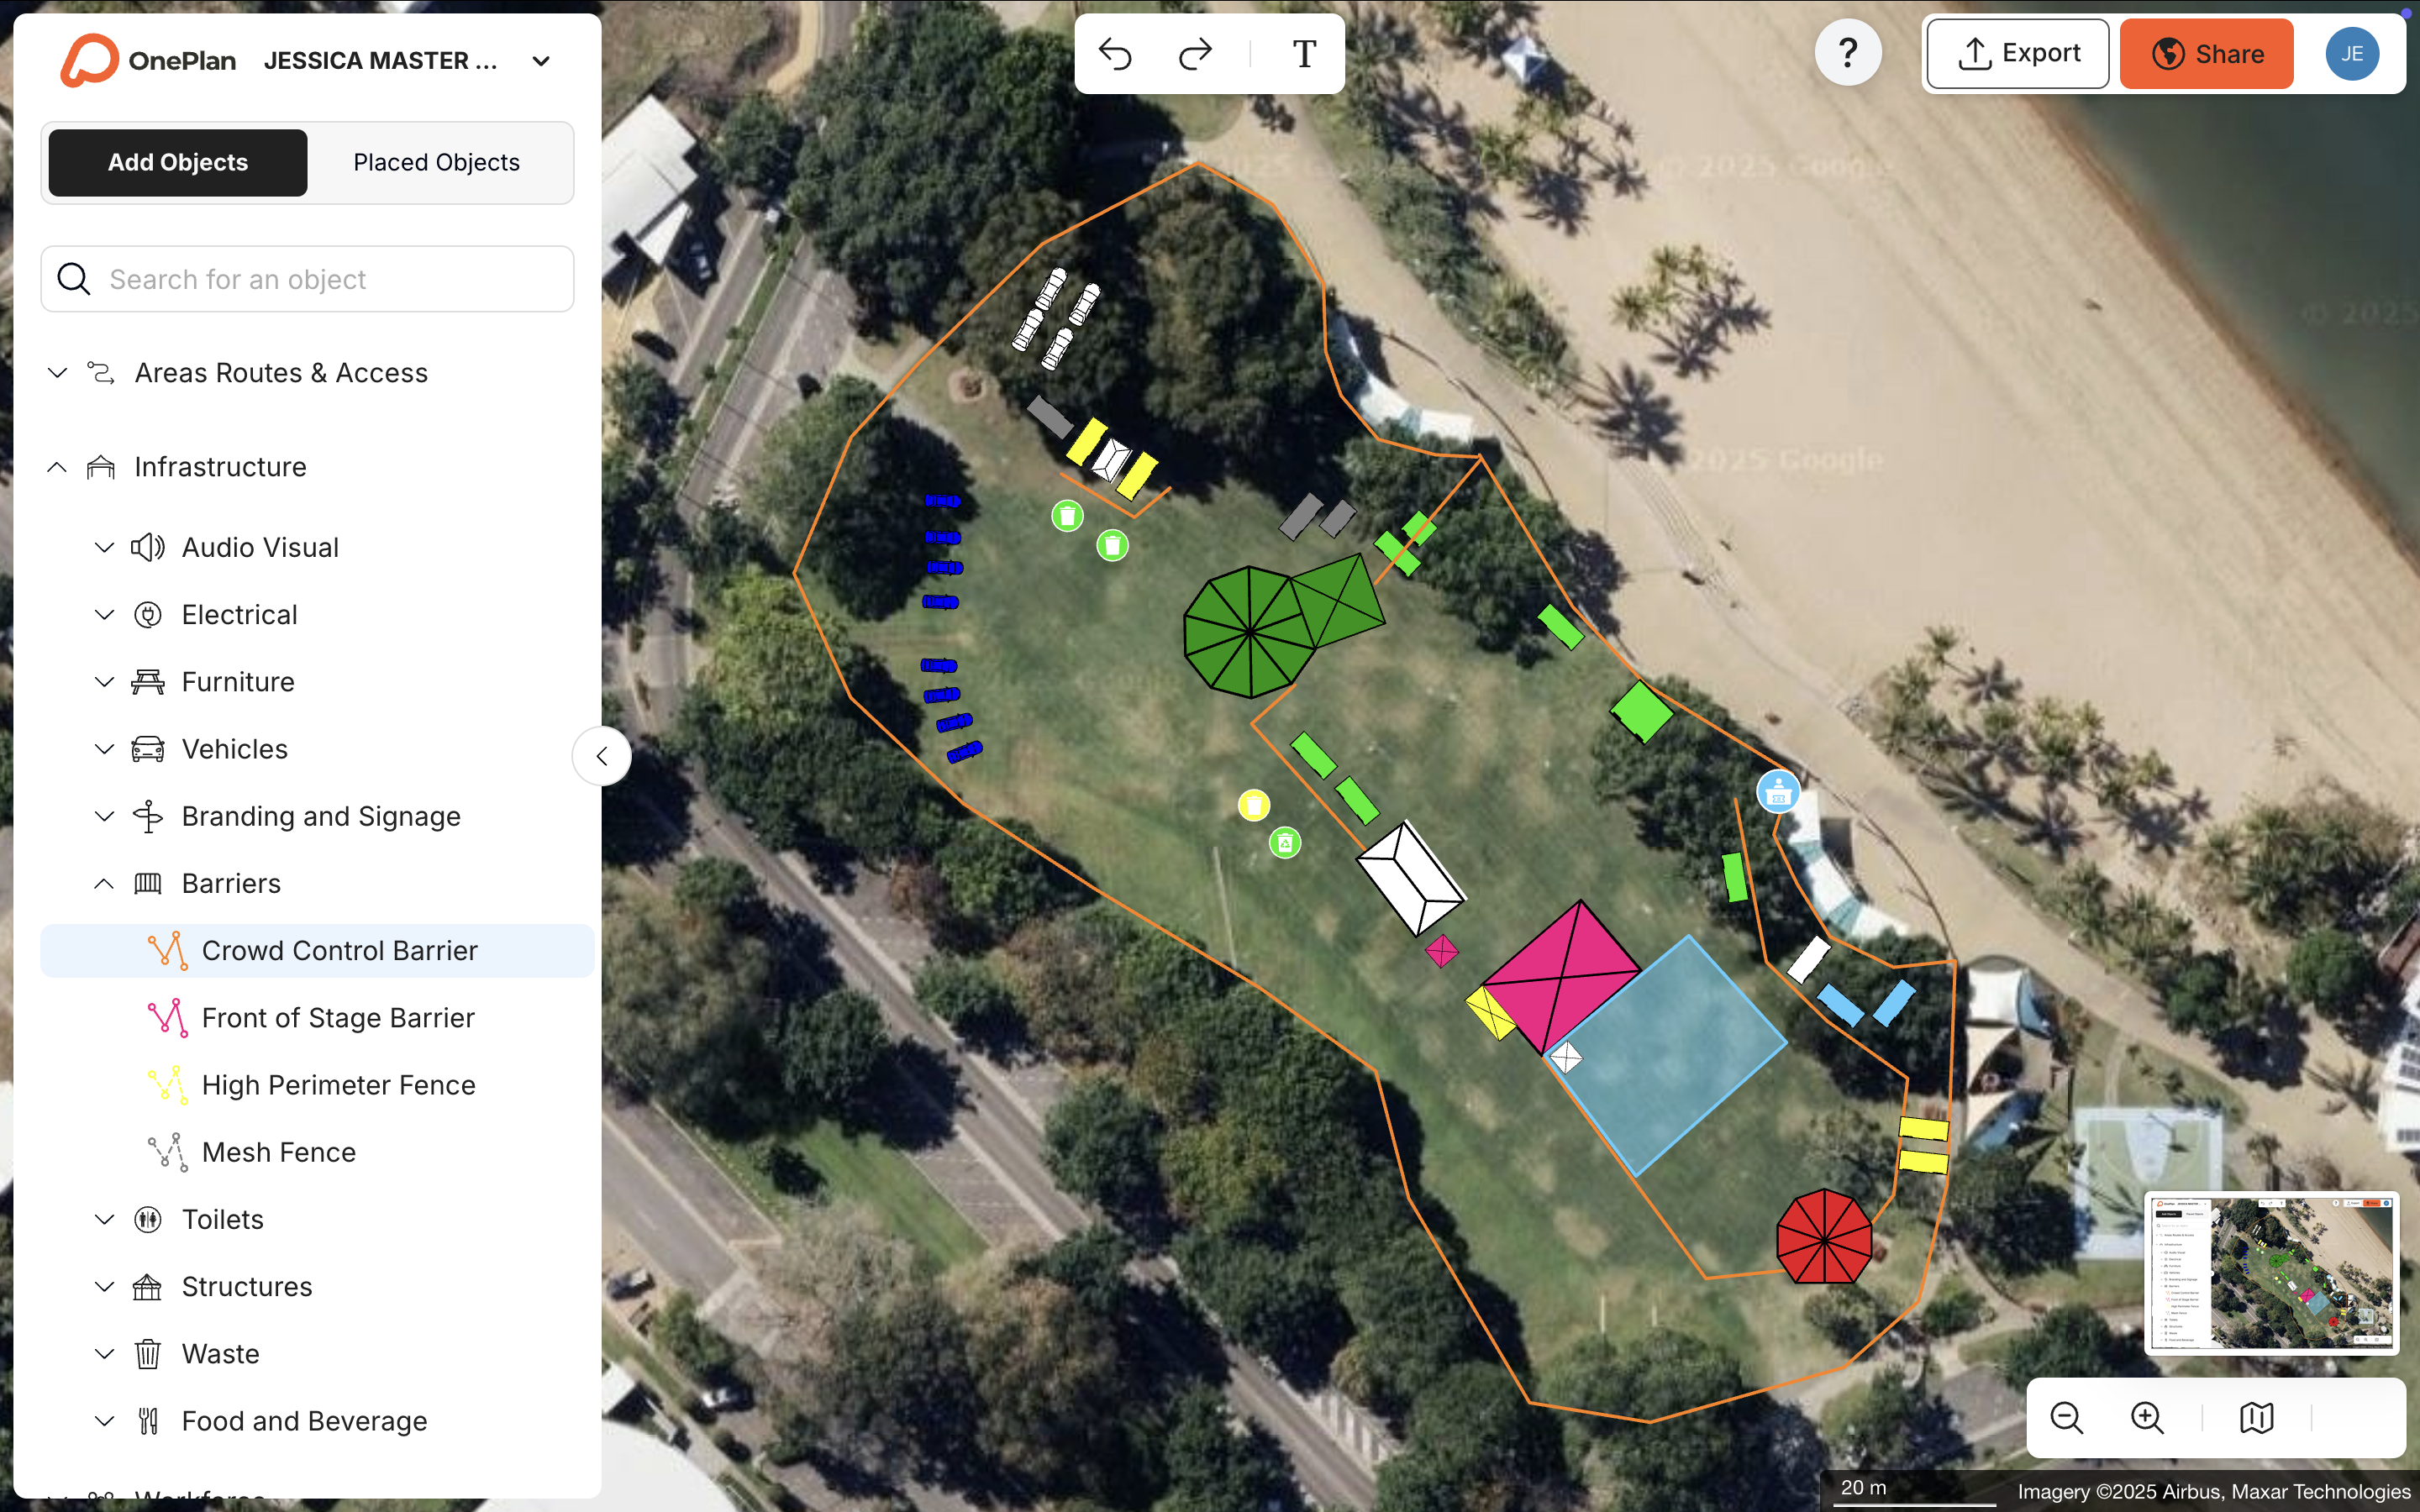
This step removes the most common manual error: measuring only part of the site, ignoring slopes or obstacles, and underestimating irregular layouts. Your perimeter figure becomes a live measurement tied to a real map, not a hand-measured estimate.
Step 2: Map Vendor Zones and Aisles with the Area and Perimeter Tool
Clear zone measurements give you control over vendor capacity, aisle flow, and back-of-house space. Once your site boundary is drawn, carve it into functional zones such as vendor rows, food and beverage areas, entertainment stages, aisle corridors, and restricted or back-of-house areas. Each zone needs its own area and perimeter figure because each drives a different infrastructure calculation.
In OnePlan, outline each zone as a separate shape. The area and perimeter calculator returns the size of each zone instantly in square feet. Vendor zones show how many stall footprints fit. Aisle widths confirm pedestrian flow. Stage and structure footprints are deducted from your crowd-standing area before you run capacity numbers in Step 3.
The Cheese & Chilli Festival, which manages over 120 food vendors across four annual events, uses OnePlan to build an accurate to-scale map and quickly place hundreds of items of event infrastructure. Precise vendor zoning means the Bill of Quantities reflects what is actually on the ground, not an approximation.
This step also reveals aisle widths that affect crowd flow and emergency access. Temporary-event planning should separate ingress and egress routes to prevent counter-flows that increase crushing risk, and design should remove choke points and dead ends while keeping exits wide and unobstructed.
Step 3: Run the Crowd-Capacity Calculator on Standing Areas
Accurate crowd capacity depends on the net standing area, not the total site size. With vendor zones, stages, and structures mapped and their footprints known, you can calculate the usable standing area available to attendees after deducting all infrastructure footprints from your total site area.
In OnePlan, outline your standing crowd zones and use the crowd capacity calculator to get an instant capacity figure based on a selectable people-per-square-foot density. Bearfoot Productions uses this approach: “The calculations for crowd capacity and parking areas are great. It’s nice to have a visual shape on our plan that shows me I can get 7,000 people at one person per square metre in there.”
Crowd density science guides your density target. The Fruin Level of Service framework, developed by John J. Fruin in the early 1970s and adopted in the Highway Capacity Manual, defines six pedestrian density levels from free circulation through breakdown conditions, providing the quantitative basis for assessing safe crowd capacity. Always verify your chosen density with your local authority, fire marshal, or permitting body because requirements vary by jurisdiction and event type.
For ingress and egress flow, use OnePlan’s free arrival and exit calculators. The arrival calculator at calculators.oneplan.io/arrival estimates queue length and queue time for ticket checks and security screening. The exit calculator at calculators.oneplan.io/exit/calculator uses exit width, crowd size, and flow rate to estimate exit capacity.
Step 4: Place Fencing, Barriers, and Toilets with Auto-Counting
Once your site boundary, zone measurements, and crowd capacity figures are set, you can place physical infrastructure on the map with confidence. Every object you drop onto the plan feeds automatically into OnePlan’s Bill of Quantities, which updates live as you build.
Fencing. Your perimeter measurement from Step 1 provides your starting linear footage. Calculate the number of temporary fence panels by dividing total perimeter length in feet by the typical panel width of 10 to 12 feet per panel, then add 10% to 15% extra panels to cover gate placements, corners, and bracing. Place fence segments on the map in OnePlan and the Bill of Quantities counts every panel for you. Bearfoot Productions used this method to confidently order over 1,000 panels of Heras fencing and 1,500 pedestrian barriers, totaling roughly 8 kilometers of fencing.
Crowd control barriers. Calculate barrier quantities by measuring total linear footage of perimeters, queue lines, stage fronts, VIP zones, and restricted areas, then divide by standard barrier length of 6.5 to 8.5 feet, and add a 10% to 20% buffer for overlaps, gates, and emergency access. The Orkney 2025 International Island Games team reported that OnePlan’s pedestrian barrier calculator feature “was magic” and made ordering far easier.
Portable toilets. The Portable Sanitation Association International sets the industry baseline at one portable toilet per 50 people for events lasting up to four hours. That ratio tightens for longer events, where industry practice moves toward one portable toilet per 40 people when the event runs beyond four hours or serves food and alcohol, with an additional 10% to 20% added when alcohol is served. Beyond these capacity ratios, accessibility requirements also apply: the Americans with Disabilities Act requires at least one accessible portable toilet for every 20 standard units at public events, with units placed on level ground and with unobstructed access. Place toilet clusters on the map and OnePlan counts every unit in the Bill of Quantities. Requirements vary by state and local jurisdiction, so always confirm with your permitting authority.
Step 5: Export Maps and Inventory for Suppliers and Permits
With all infrastructure mapped and counted, you can package the data for suppliers, internal teams, and permitting authorities. Once your infrastructure is placed, OnePlan generates two outputs that replace the manual spreadsheet entirely: a high-resolution map and an exportable Bill of Quantities.
The map exports as a print-ready PNG up to A0 size, complete with a legend. Suppliers use it to position infrastructure on site. Permitting authorities use it to approve the layout. Your operations team uses it on event day. The Orkney Games team avoided purchasing expensive CAD software by using OnePlan’s accurate, interactive layouts exported as PNGs and shared via view-only links.
The Bill of Quantities exports to Excel or CSV as a structured inventory. Every fence panel, barrier, toilet unit, and tent is counted, categorized, and ready to send to suppliers. Festival Foods uses OnePlan’s Bill of Quantities tool and dashboard reports to calculate and export inventory needs automatically across 11 simultaneous events.
Before you finalize your gate configuration, validate your gate count against expected attendance using the arrival and exit calculators to confirm queue times and exit capacity meet your permit requirements.
Manual Spreadsheets vs. Map-Based Market Planning
The table below compares manual planning and map-based planning across four dimensions that matter to market and festival organizers. Every figure comes from published case studies and industry sources.
| Dimension | Manual (spreadsheets + static maps) | Map-based (OnePlan) | Source |
|---|---|---|---|
| Planning time per event | 2 weeks at 3–4 hours/day | Map built in ~2 days; 85% time saving | SoulFest case study |
| Site visits required | ~20 pre-event visits per year | Reduced to ~2 visits per year (75% reduction) | Beirut Marathon case study |
| Infrastructure ordering accuracy | Prone to perimeter vs. area measurement errors, manual buffer guesswork | Exact linear footage from live map, auto-counted Bill of Quantities | Proper Site Services; Bearfoot Productions case study |
| Return on investment | No measurable ROI from tool itself | 5x ROI (local government); 13x ROI (major venue) | Eagle Mountain City; Silverstone case studies |
Real-World Results from Markets and Fairs
SoulFest. One of New England’s largest music festivals, with more than 75 artists over three days, previously ran site planning on Google Maps and Photoshop with spreadsheets for everything else. After switching to OnePlan, the team cut planning time by 85%, dropping from two weeks at 3–4 hours a day to one hour a day for a week, with almost the entire map built in two days. The Bill of Quantities reports supported accurate fencing and infrastructure orders.
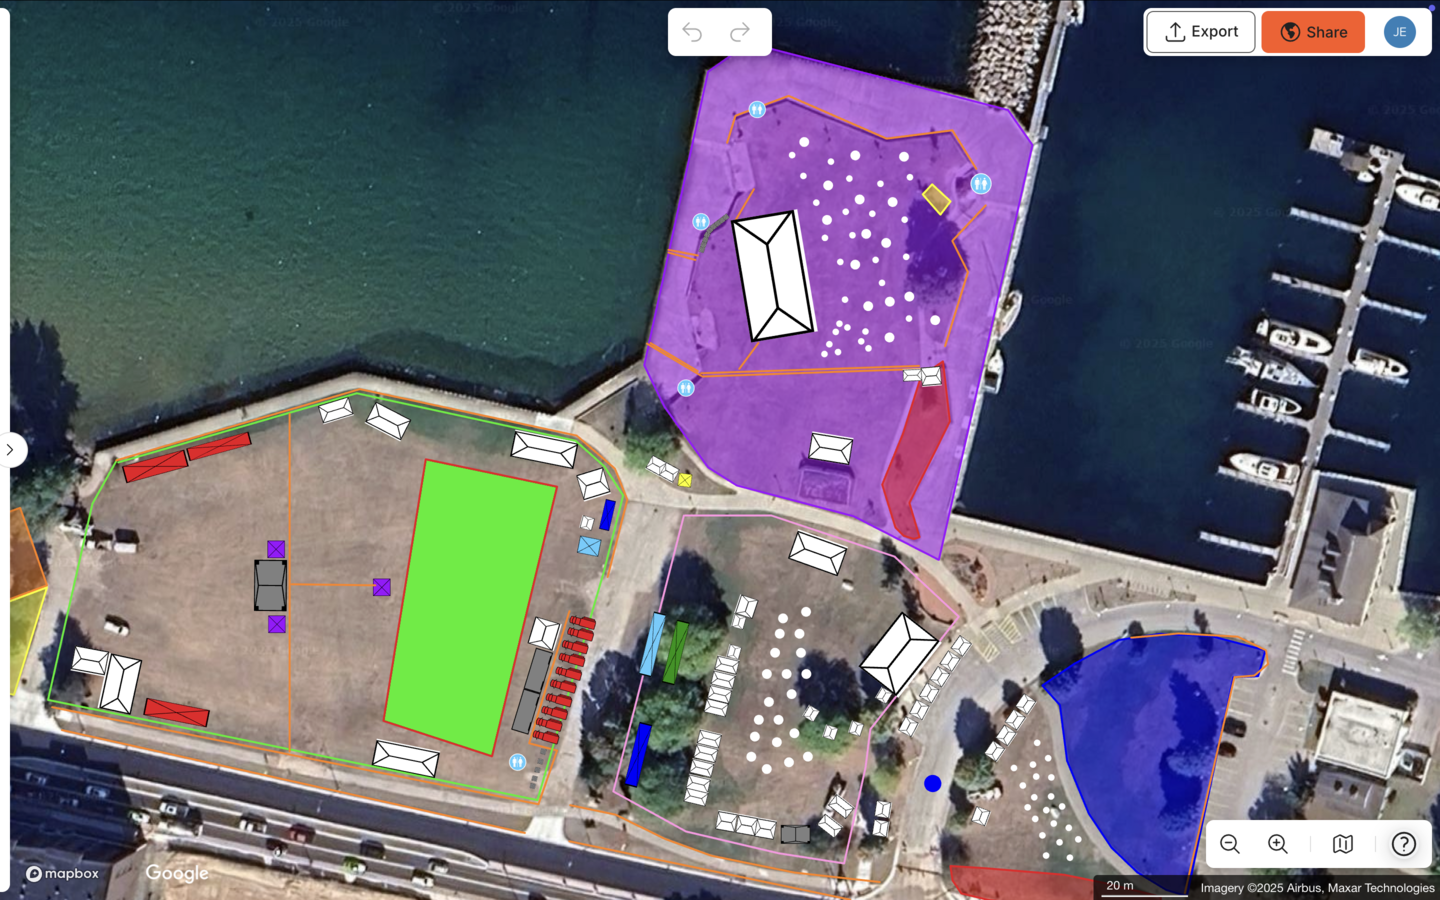
National Cherry Festival. Planning for 600,000 attendees requires infrastructure calculations at a scale that spreadsheets struggle to handle reliably. The National Cherry Festival’s Director of Event Operations rates OnePlan 10 out of 10 and recommends it to any large-scale event company looking for robust layout software.
Bearfoot Productions. The agency grew from small pub gigs to 10,000-capacity festivals and needed procurement accuracy to match. OnePlan enabled the team to scale from small pub gigs to 10,000-capacity festivals with procurement accuracy to match, as described earlier.
Common Planning Challenges and Simple Fixes
Three problems appear repeatedly in manual infrastructure planning for public markets and fairs.
Wrong fence length. The most common error is measuring in square footage rather than linear perimeter feet. A 100-by-100-foot market site has 10,000 square feet of area but requires 400 linear feet of perimeter fencing, a figure that only a perimeter measurement produces. The fix is simple: draw your boundary on a live map and read the perimeter directly.
Failed safety checks. Improvised crowd control on event day raises concerns for permit officials and insurance carriers, increasing risks of safety incidents and compliance failures. Common manual errors include underestimating attendance beyond ticket counts, forgetting entry and exit layouts that add barrier ends and transitions, and failing to plan emergency access lanes. The fix is to place all barriers on the map before the event, verify quantities against your permit requirements, and use the Bill of Quantities as your supplier order document.
Version-control chaos. When the site plan lives in an emailed PowerPoint file, different departments such as operations, security, vendors, and local authorities work from different versions. Eagle Mountain City’s Events Manager described the old approach: “Gone are the days of creating separate layouts for fire, police, facilities, and other departments. Now I can create a single, all-encompassing layout.” The fix is one live plan in OnePlan, shared via a view-only link so every stakeholder always sees the current version.
Measuring Success with Map-Based Planning
The indicators that map-based infrastructure calculation is working are practical and measurable.
- Fewer plan revisions between first draft and permit submission
- Supplier orders that match what arrives on site, with no emergency top-up deliveries
- Reduced number of pre-event site visits needed to verify measurements
- Faster approval cycles because the submitted map is to scale and the Bill of Quantities is attached
- Consistent infrastructure quantities year over year for recurring markets, because the plan is reusable
OnePlan has powered more than 200,000 events across 150 countries, from community fairs to the Paris 2024 Olympic Games. The same tools that help a small market manager order the right number of fence panels help a 600,000-attendee festival plan its entire site. The scale changes, but the workflow stays the same.
Frequently Asked Questions
How long does it take to build a market site plan in OnePlan?
Most organizers have a working plan, with boundary drawn, vendor zones mapped, and initial infrastructure placed, within a few hours of signing up. SoulFest built almost its entire festival map within two days. For a smaller public market with a straightforward footprint, the initial plan can be ready in under an hour. OnePlan uses drag-and-drop tools and runs in any web browser with nothing to download or install, so setup time stays minimal.
Can I reuse my OnePlan layout for a recurring annual market?
Yes. Once your plan is built, it becomes a reusable base for every future edition of the event. You can duplicate the plan, update vendor placements, adjust infrastructure quantities, and export a fresh Bill of Quantities without redrawing the site boundary or repositioning fixed infrastructure. This reuse creates one of the most significant time savings for market managers who run the same event annually.
How do I share the plan with my local permitting authority or vendors?
OnePlan generates a high-resolution PNG map export, up to A0 and print-ready, plus a CSV Bill of Quantities that you can attach to any permit application or supplier brief. You can also share a live, view-only link to the plan so your permitting authority or vendors always see the most current version without resending files. The link can be password-protected for added security.
Does OnePlan work for indoor markets as well as outdoor ones?
OnePlan supports both outdoor sites and indoor spaces. For indoor markets, import your floor plan as a .png file, scale it onto the map, and plan on top of it. Multi-level venues can be planned across floors. OnePlan focuses on operational and spatial planning, such as where infrastructure, vendors, and crowds go, rather than 3D interior visualization.
What if my market site has an irregular shape or obstacles like trees and structures?
OnePlan’s area and perimeter calculator works on any polygon shape, however irregular. Draw around obstacles to exclude them from your usable area, and the tool returns the correct net figure. This approach helps especially for markets held in parks or town squares where permanent structures, trees, and pathways reduce the available footprint. The live satellite map base lets you see those obstacles as you draw, rather than discovering them on setup day.
Start Calculating Accurately Today
Manual spreadsheets and static maps have a ceiling. They cannot measure a live perimeter, auto-count barrier segments, or generate a permit-ready Bill of Quantities from a single plan. OnePlan delivers all of that in a browser, with your first event available at no cost.
Market managers, fair organizers, and local-government events teams across 150 countries have replaced guesswork with exact figures, and the results appear in fewer site visits, accurate supplier orders, and smoother permit approvals.