
Written by: Paul Foster, Founder, CEO, OnePlan
The Operational Challenge: Rejected Diagrams and Last-Minute Changes
A rejected crowd flow diagram delays more than paperwork. It triggers on-site layout changes, emergency-access redesigns, and resubmissions that drain budgets and timelines. The root cause is usually the same. Plans built in PowerPoint, Excel, or static screenshots are not to scale, so what looks right on screen does not match the physical site. Reviewers from fire marshals to parks departments spot the discrepancies quickly, and the permit goes back for revision.
A repeatable, to-scale workflow prevents this cycle. It produces an accurate crowd flow diagram on the first submission that shows every ingress and egress route, emergency access lane, high-density zone, and barrier line at the correct dimensions.
Key Takeaways for Faster Permit Approval
- Static tools like PowerPoint and Excel produce crowd flow diagrams that are not to scale, which causes immediate permit rejections from fire marshals and parks departments.
- A repeatable five-step workflow that gathers requirements, outlines boundaries, places routes to scale, runs capacity calculations, and exports cleanly reduces revision cycles and speeds up first-submission approval.
- Common rejection triggers include undersized emergency lanes, missing queue space, undocumented capacity figures, and files that lack legends or scale bars.
- Specialized mapping platforms provide live geo-accurate maps, built-in calculators, real-time collaboration, and print-ready exports that manual methods cannot match.
- OnePlan turns the entire workflow into a single live plan with built-in calculators and one-click exports. Book a 15-minute demo to see how your next permit package can be submission-ready in hours, not days.
Step 1: Gather Site Dimensions and Authority Requirements
This step focuses on collecting every input the reviewing authority will check before you draw a single line.
Inputs needed include:
- The official permit application checklist from your local authority
- Site boundary dimensions (length, width, total area in square feet)
- Minimum emergency access lane widths specified by your fire marshal
- Maximum crowd density thresholds for your event type and jurisdiction
- Anticipated attendance figures and ticketing or license caps
A common rejection trigger at this stage is missing or misquoting the fire marshal’s minimum lane width, often because planners assume a standard width applies everywhere. That assumption fails. Fire apparatus access roads must meet the minimum width and clearance requirements specified by the local fire marshal, and those requirements differ by state and municipality. Confirm the exact figures with your local fire authority before you draw a single lane, because discovering a mismatch after submission means redrawing the entire emergency access layout.
Step 2: Draw the Site Boundary and Emergency Lanes on a Live Map
This step establishes the site perimeter and locks in emergency vehicle corridors before you place any other infrastructure. Working on a live, to-scale map instead of a blank slide ensures the boundary reflects real-world dimensions from the start.
Inputs needed include:
- Verified site dimensions from Step 1
- A geo-accurate base map (satellite or street view)
- Fire marshal access-road standards for your jurisdiction
Rejection risks at this stage include emergency lanes that do not meet required minimum widths or vertical clearances. Chesapeake, Virginia’s fire department requires an all-weather driving surface of not less than 20 feet of unobstructed width. A second common rejection trigger is the absence of turning-radius annotations specified by the fire code official. Plans that omit these details are routinely sent back.
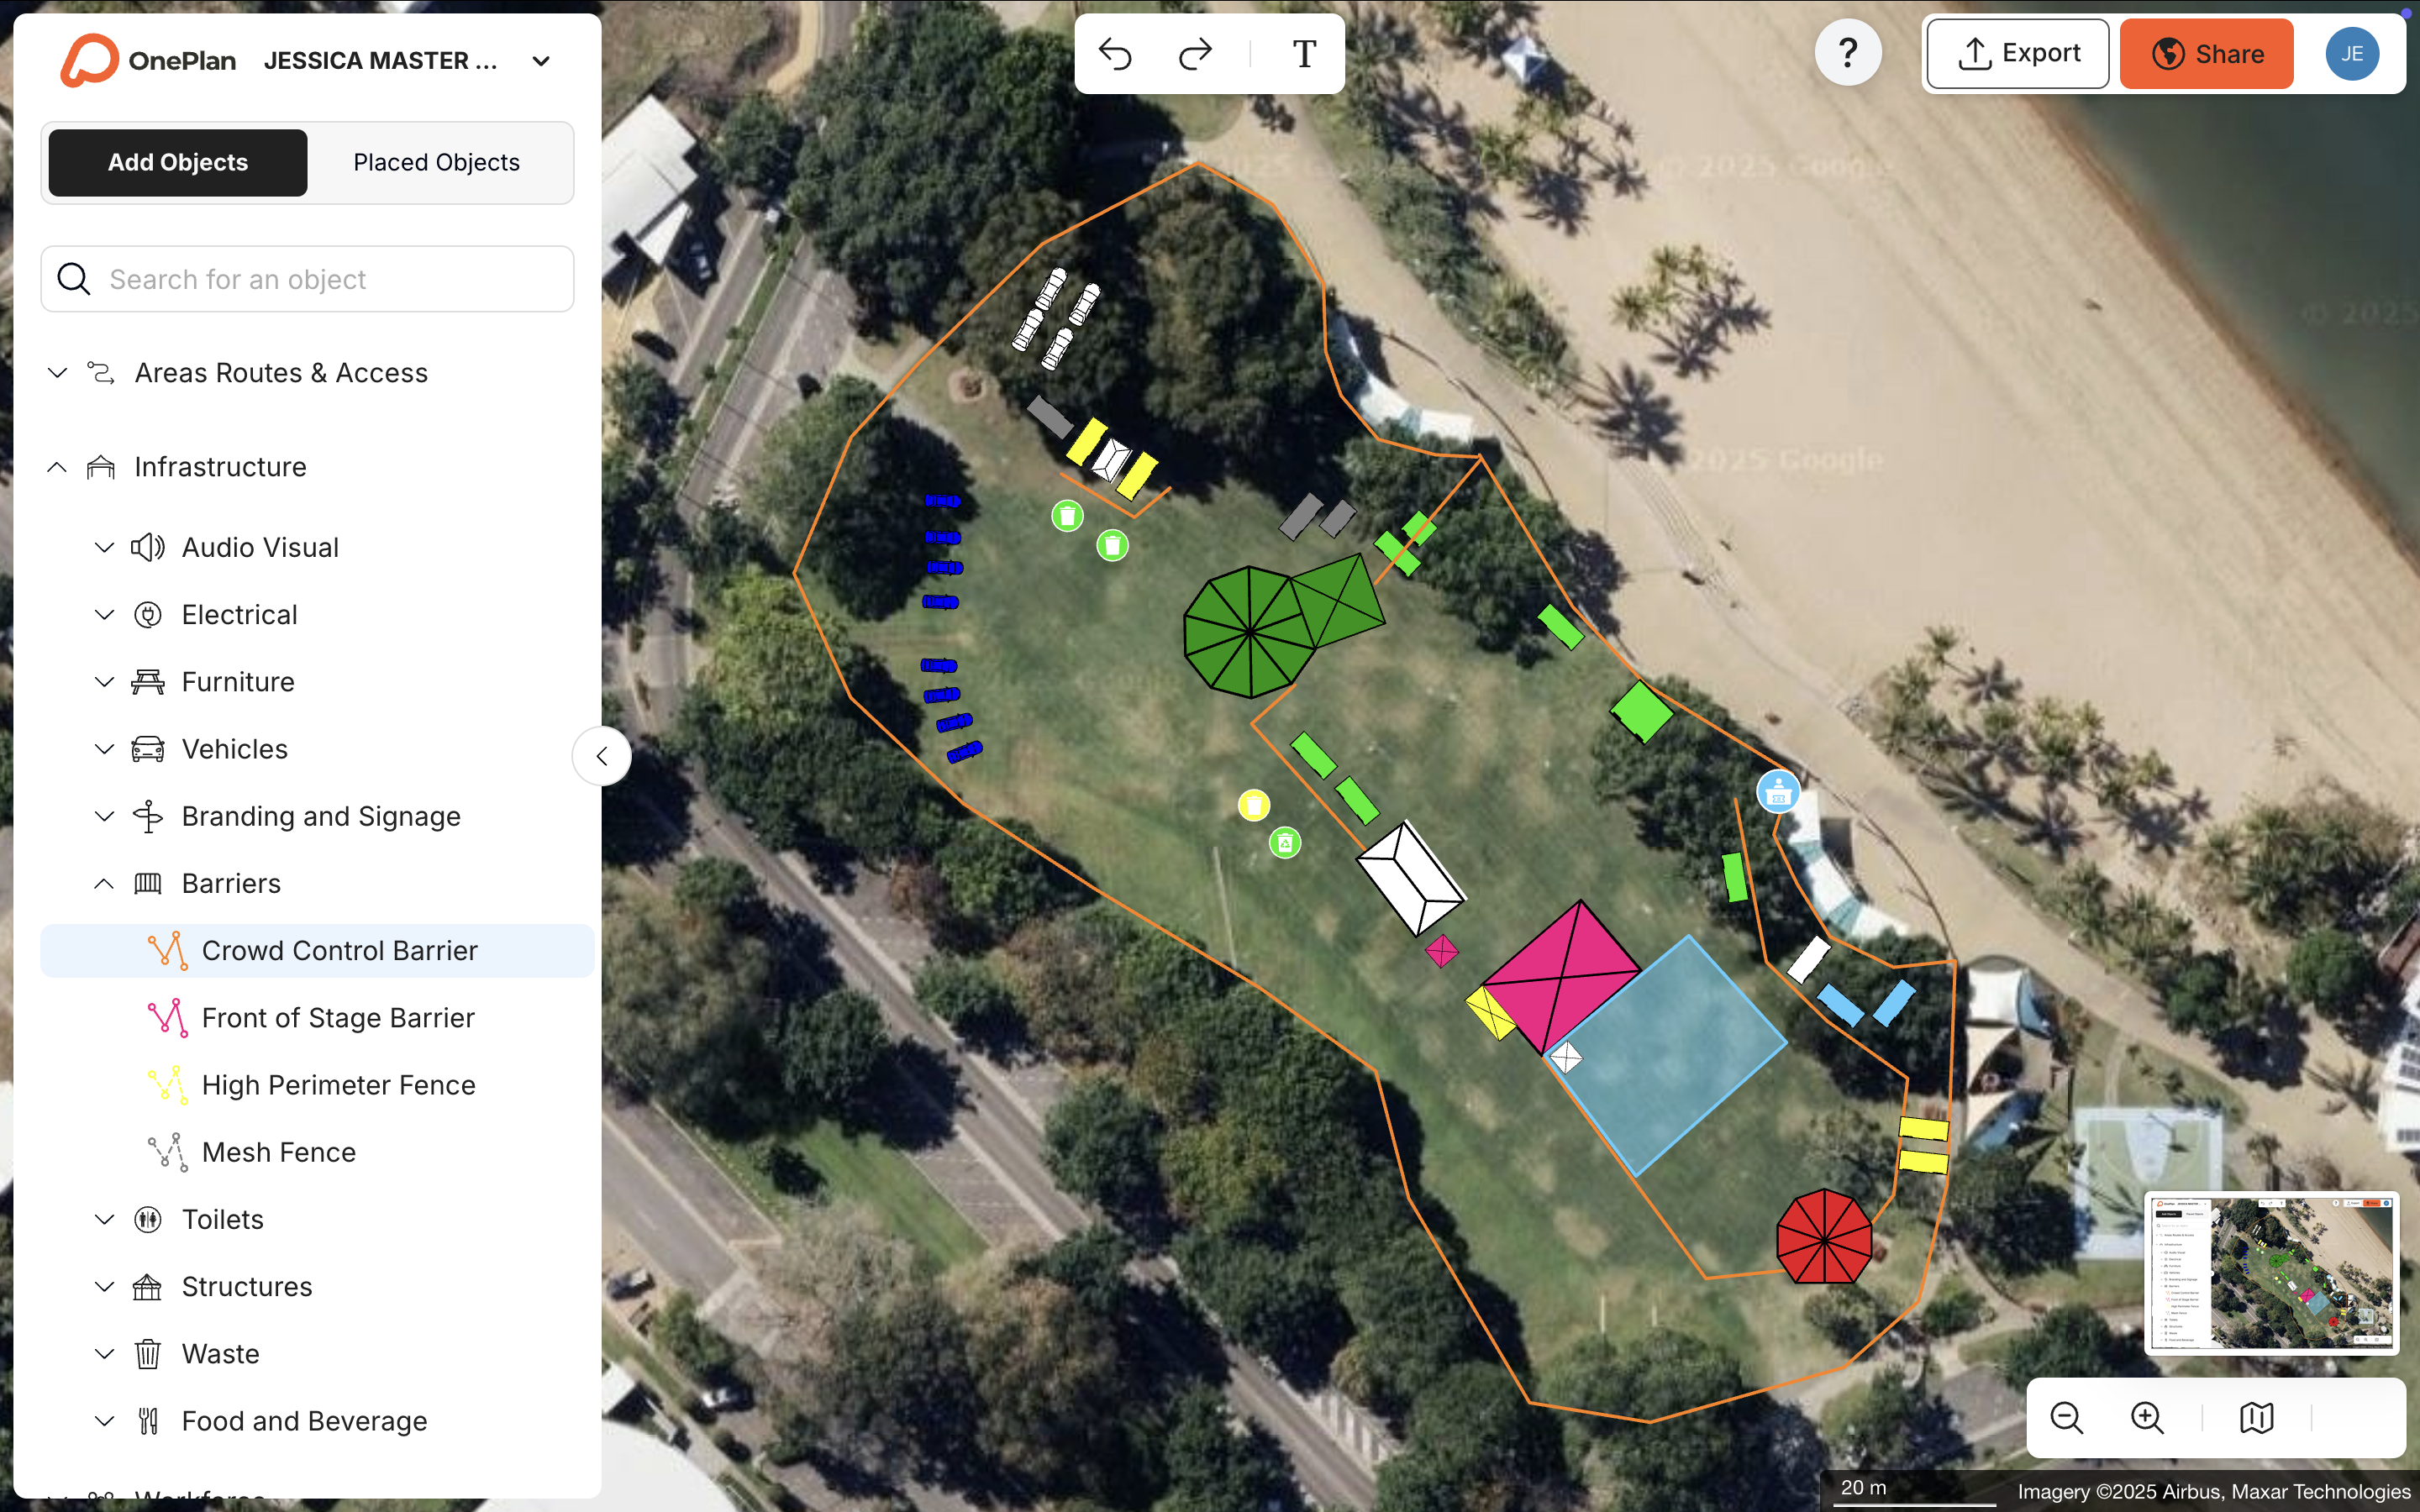
In OnePlan, you draw the site boundary directly on a live satellite or street map powered by leading GIS technology. Every shape stays accurately to scale as you zoom, so the emergency lane you draw on screen matches the required width on the ground.
Step 3: Map Routes, High-Density Zones, and Barriers to Scale
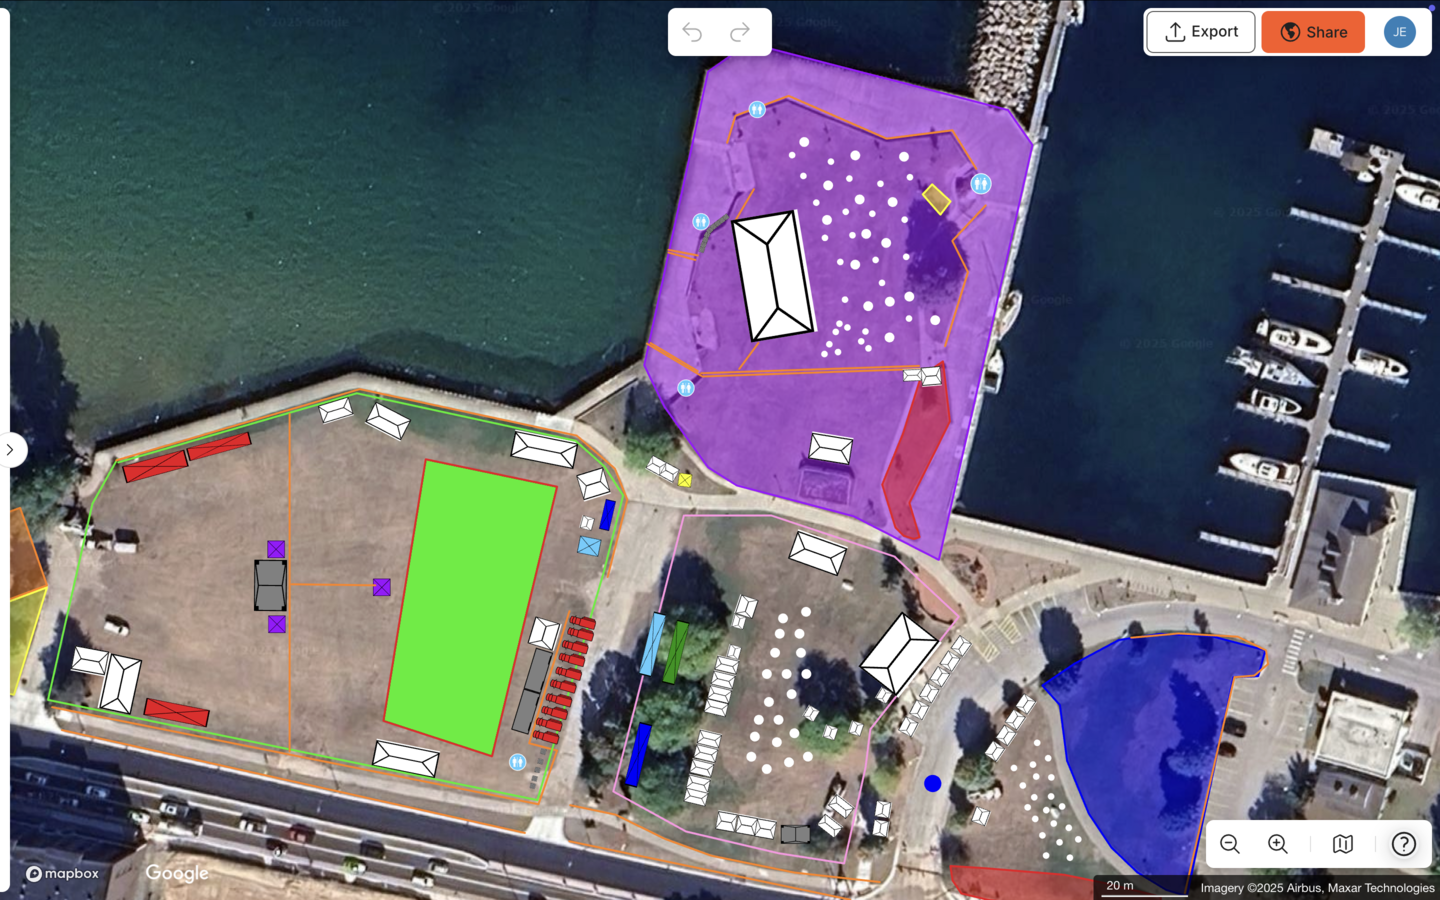
This step maps every pedestrian and vehicle movement path, identifies where crowds will concentrate, and positions crowd barriers and fencing accurately within the site boundary from Step 2.
Inputs needed include:
- Confirmed entry and exit point locations
- Stage, vendor, and amenity placement decisions
- Barrier and fencing quantities
- Queue-line design for ticketing and security screening
Rejection risks here include undersized queue space and missing minimum exit widths. Exit pathways and queue lines in temporary event layouts must maintain sufficient clear width for wheelchair users and those using mobility aids. Authorities also look for evidence that ingress and egress routes are separated to eliminate counter-flows. This practice appears consistently in crowd-management frameworks such as the DIM-ICE model, which examines Design, Information, and Management across Ingress, Circulation, and Egress phases.
The North Texas Tribute Jam used OnePlan to share detailed plans for roadblocks, crowd control, and traffic management with the City of Lewisville’s Health and Safety Department. As organizer Evelin Costa noted: “Working with the City of Lewisville’s Health and Safety Department was much simpler thanks to OnePlan. Being able to share detailed plans for roadblocks, crowd control, and traffic management meant we got the necessary approvals quickly and without headaches.”
Step 4: Calculate Crowd Capacity and Arrival/Exit Times
This step produces defensible, jurisdiction-ready capacity figures for every zone on the diagram and models how long your expected attendance will take to enter and exit the site safely.
Inputs needed include:
- Area measurements for each crowd zone (in square feet)
- Expected attendance and ticketing caps
- Number and width of entry and exit portals
- Security screening and ticket-check configuration
Rejection risks at this stage include capacity estimates that exceed safe density thresholds or that lack a documented methodology. Venue capacity determination integrates crowd density standards, entry throughput rates, internal circulation capacity, and emergency egress parameters to calculate the maximum number of people that can be safely accommodated and evacuated, rather than the theoretical physical maximum. Reviewers increasingly expect organizers to show their working, not just a headline number.
Use OnePlan’s free arrival calculator to estimate queue length and queue time for ticket checks and security screening, and the exit calculator to model exit capacity based on exit width, crowd size, and flow rate. These tools provide documented, shareable outputs that reviewers can follow. Note that OnePlan’s in-platform crowd capacity calculator covers standing areas only.
Step 5: Export a Print-Ready Map and Bill of Quantities
This step produces a complete, print-ready permit package that includes the crowd flow diagram, a legend, and a structured inventory of all infrastructure on site.
Inputs needed include:
- Finalized plan from Steps 1–4
- Authority’s preferred file format and print size
- List of all infrastructure items placed on the map
Rejection risks at this stage include missing legends, non-print-ready files, and diagrams submitted without a scale bar. Wingecarribee Shire Council in New South Wales, Australia prefers but does not require site plans to be drawn to scale and provides no specifications for scale bars or legends. Plans exported from a non-specialist tool as a screenshot rarely meet print-resolution standards and often lack a legend entirely.
OnePlan exports high-resolution PNG maps up to A0 size with a separate legend generator and auto-generates a Bill of Quantities that exports to Excel or CSV. Every object placed on the map, including crowd barriers, fencing, tents, and signage, appears in the inventory automatically, so the permit package and procurement list come from the same source of truth.
The Cheese & Chilli Festival uses OnePlan’s crowd area measurement tools, queue and evacuation calculators, and emergency vehicle route planning for risk assessments and management plans. The team produces the documentation needed for permit review without rebuilding anything from scratch.
Tools Comparison: Manual Methods Versus Specialized Mapping Platforms
You now have a clear five-step workflow, so the next decision is which tool can support it without introducing scale and version-control errors that cause rejections. The comparison below shows how manual methods stack up against specialized mapping platforms across the dimensions that determine whether your diagram clears review on the first submission.
| Dimension | PowerPoint / Excel / Screenshots | CAD / AutoCAD | OnePlan |
|---|---|---|---|
| To scale on a live map | No, shapes placed on static screenshots with no geo-accuracy | Yes, precise, but requires specialist training | Yes, every object stays to scale on a live satellite or street map |
| Crowd capacity and arrival/exit calculations | Manual formulas in spreadsheets, no spatial integration | Not built in, requires separate tools | Built-in standing crowd capacity calculator, free arrival and exit calculators |
| Version control and real-time collaboration | Files emailed back and forth, multiple departments end up with separate plans | Limited, plan is only as current as the last exported PDF | Single live plan, multiple editors simultaneously, always current |
| Permit-ready export | Low-resolution screenshots, no legend generator, no Bill of Quantities | High-resolution output but requires CAD operator, one day for eight maps in CAD versus two hours in OnePlan | High-resolution PNG up to A0, legend generator, auto-generated Bill of Quantities to Excel/CSV |
Common Crowd Flow Diagram Mistakes to Avoid
The following issues account for most diagram rejections and on-site layout failures.
- Undersized emergency lanes. Drawing lanes by eye on a non-scaled canvas produces widths that look correct but measure short. Draw on a live, to-scale map and verify the lane width using the area and perimeter calculator before exporting.
- Missing queue space. Queue lines are often omitted or compressed to fit the diagram. Switchback queue aisles require sufficient clear width for wheelchair users and those using mobility aids. Plan this space explicitly on the diagram.
- Version-control errors. When plans are emailed as static files, different departments act on different versions. A single live plan shared via a secure link removes this risk.
- Capacity figures without methodology. A headline number with no supporting calculation is increasingly rejected. Use documented tools, such as OnePlan’s calculators, and include the outputs in the permit package.
- No legend or scale bar. Many jurisdictions explicitly require both. Generate the legend from the same platform used to build the plan so it stays synchronized with the diagram.
Text-Based Example Layout You Can Recreate
The following descriptive layout outlines a 500-person outdoor event on a rectangular site. Use it as a reference when building your own plan.
+----------------------------------------------------------+ | [NORTH BOUNDARY — PUBLIC ROAD FRONTAGE] | | Main Entry Gate (36 in min. clear width per portal) | | ↓ Ingress Route (one-way, 10 ft wide) | | | | [WEST SIDE] [SITE INTERIOR] [EAST SIDE] | | Emergency Stage (high-density Emergency | | Access Lane zone, front-of-stage Access Lane | | 20 ft wide, crowd area outlined 20 ft wide, | | 13 ft 6 in and capacity- 13 ft 6 in | | vertical calculated) vertical | | clearance clearance | | | | Vendor Row ←→ Crowd Barrier Line ←→ Vendor Row | | (moderate density) (moderate density) | | | | ↑ Egress Route (one-way, separated from ingress) | | Exit Gates (36 in min. clear width per portal) | | [SOUTH BOUNDARY — SECONDARY ROAD] | +----------------------------------------------------------+
Key elements shown include the site boundary, emergency access lanes on both sides, separated one-way ingress and egress routes, a high-density zone in front of the stage with a crowd barrier line, and vendor rows in moderate-density areas. Verify all measurements to scale before submission.
Success Indicators for Your Crowd Flow Workflow
A well-executed crowd flow diagram workflow produces measurable outcomes beyond permit approval.
- First-submission approval rate. Plans built to scale with documented capacity calculations and complete legends clear review without repeated revision cycles.
- Reduced site visits. The Beirut Marathon cut approximately 20 pre-event site visits per year down to one or two by measuring and validating layouts remotely on an accurate map before on-site checks.
- Fewer on-site layout changes. When the diagram reflects real-world dimensions, infrastructure arrives in the right place and at the right size. Bearfoot Productions confidently ordered 8 km of fencing based on OnePlan measurements, with no guesswork and no over-ordering.
- Faster stakeholder alignment. The same Coventry Moves event mentioned earlier also demonstrates faster stakeholder alignment. Stadium managed 110 stakeholders across 400 closures and 7 procession routes from a single OnePlan diagram, reducing planning time from over 200 hours to 75 hours.
- Reusable templates. A plan built once becomes the base for next year’s event, which cuts repeat planning time significantly. Eagle Mountain City reduced per-event planning from 8–10 hours to a few hours and reported a 5x ROI by reusing OnePlan templates across community events.
Frequently Asked Questions
How long does it typically take to prepare a permit-ready crowd flow diagram?
Timeline depends on event size, site complexity, and how complete your site dimensions and authority requirements are before you start. For a straightforward outdoor event with a single stage and a defined perimeter, an experienced planner working in a to-scale mapping platform can produce a permit-ready diagram in a few hours. Larger or more complex events, such as multi-stage sites or events requiring traffic control plans, typically take one to two days of active planning. The biggest time sink in manual workflows is the back-and-forth between measuring on site, adjusting a non-scaled diagram, and resubmitting. Working on a live, to-scale map from the start removes most of that iteration.
Can I share the diagram with police, fire, and other stakeholders?
You can and should share the diagram early. Reviewing authorities, including fire marshals, police departments, and parks departments, often provide informal feedback before formal submission, which reduces the risk of rejection. In OnePlan, you can share a live, view-only link that can be password-protected, so every stakeholder always sees the most current version of the plan without anyone resending files. Multiple team members can also edit the same plan simultaneously, so updates made after a stakeholder review appear immediately for everyone.
How do I scale the same workflow for events from 500 to 50,000 attendees?
The five-step workflow stays the same regardless of event size, while the inputs and outputs grow in complexity. For larger events, Step 1 expands to include multiple authority contacts such as fire, police, traffic, and medical. Step 4 requires capacity calculations for multiple zones rather than a single crowd area. The critical discipline at any scale is working to scale from the start. A 50,000-person event with an inaccurate base map faces the same rejection risks as a 500-person event with a hand-drawn sketch. OnePlan’s crowd capacity calculator, arrival calculator, and exit calculator all scale with the event. Outline a larger crowd area, enter a larger attendance figure, and the outputs update instantly. The platform has supported events from small community fairs up to the Paris 2024 Olympic and Paralympic Games.
What happens when the layout changes after the initial submission?
Layout changes after submission are one of the most common sources of permit complications. If a change affects emergency access lanes, exit widths, or crowd capacity in any zone, the revised diagram typically needs resubmission to the reviewing authority. The practical fix is to maintain a single live plan that all stakeholders use, so any change is immediately visible to everyone and the exported diagram stays current. In OnePlan, editing the live plan and exporting a high-resolution map takes minutes rather than hours, which makes resubmission far less disruptive than rebuilding a static file from scratch.
Conclusion: Turn the Five Steps Into a First-Submission Approval
The five-step workflow outlined above turns the common permit rejection cycle into a first-submission approval process. Each step has defined rejection risks, and every one of them becomes harder to manage when the plan lives in a non-scaled tool.
OnePlan turns all five steps into a single live, to-scale plan on a geo-accurate map with built-in calculators, real-time collaboration, and one-click export of everything a permit package needs. From a 500-person community event to a 50,000-person festival, the workflow stays consistent, and the first-submission approval rate reflects that consistency.