
Written by: Paul Foster, Founder, CEO, OnePlan
Key Takeaways for Street Fair Site Maps
- Accurate, to-scale street fair site maps support vendor placement, road closures, crowd safety, and permit approvals from city authorities.
- Successful planning starts by gathering site dimensions, existing plans, vendor requirements, and stakeholder inputs before mapping.
- Using a live satellite or street map base with drag-and-drop objects keeps every element precisely sized and reduces last-minute layout changes.
- Built-in tools for area calculations, crowd capacity, and auto-generated Bills of Quantities remove guesswork and speed up permitting and procurement.
- See those built-in tools in action. Book a demo to walk through a street fair site map from footprint to permit-ready export, or start your first event free.
Step 1: Gather Site Dimensions, Existing Plans, and Stakeholder Requirements
Collect every input that will shape the plan before placing a single object on a map. This approach prevents rework later and keeps the finished map aligned with real-world constraints from the start.
Required inputs include:
- The street closure order or park use permit application, which defines the legal footprint
- Any existing site plans, GIS files, or aerial imagery held by the city or parks department
- Vendor contracts or applications that specify booth sizes (typically 10×10 ft or 10×20 ft)
- Requirements from fire, police, and public works, including minimum emergency access lane widths
- ADA accessibility obligations, which apply to both city-run events under Title II and privately operated fairs under Title III
- Utility locations such as hydrants, manholes, overhead lines, and underground services
Those inputs define what you are planning within the footprint. The key decision at this stage is scope, meaning how much of the surrounding street network needs to be shown, because scope determines which of those inputs you will actually use on the map. A single-block closure needs a different level of detail than a multi-street fair. Gather everything before opening your mapping tool, because the next decision, choosing your base layer, determines how accurately those measurements appear on the ground.
Ready to turn those site dimensions into an accurate map? Start your first event free or book a 15-minute demo to see the workflow in action.
Step 2: Select a Live Map Base and Import Floor Plans or Drone Shots
The base layer keeps your site map accurate at every zoom level. A screenshot from Google Maps pasted into PowerPoint is not to scale and drifts as you zoom, which is why plans built that way often fail on setup day. The Cheese & Chilli Festival found that with their previous software, “the ability to scale wasn’t great” and they often had to change layouts on site because plans were not to scale.
OnePlan’s canvas uses a live, interactive satellite or street map built on leading GIS technology. It stays geo-accurate at any zoom level, so a 10×10 ft vendor tent placed on the map is exactly 10×10 ft on the ground.
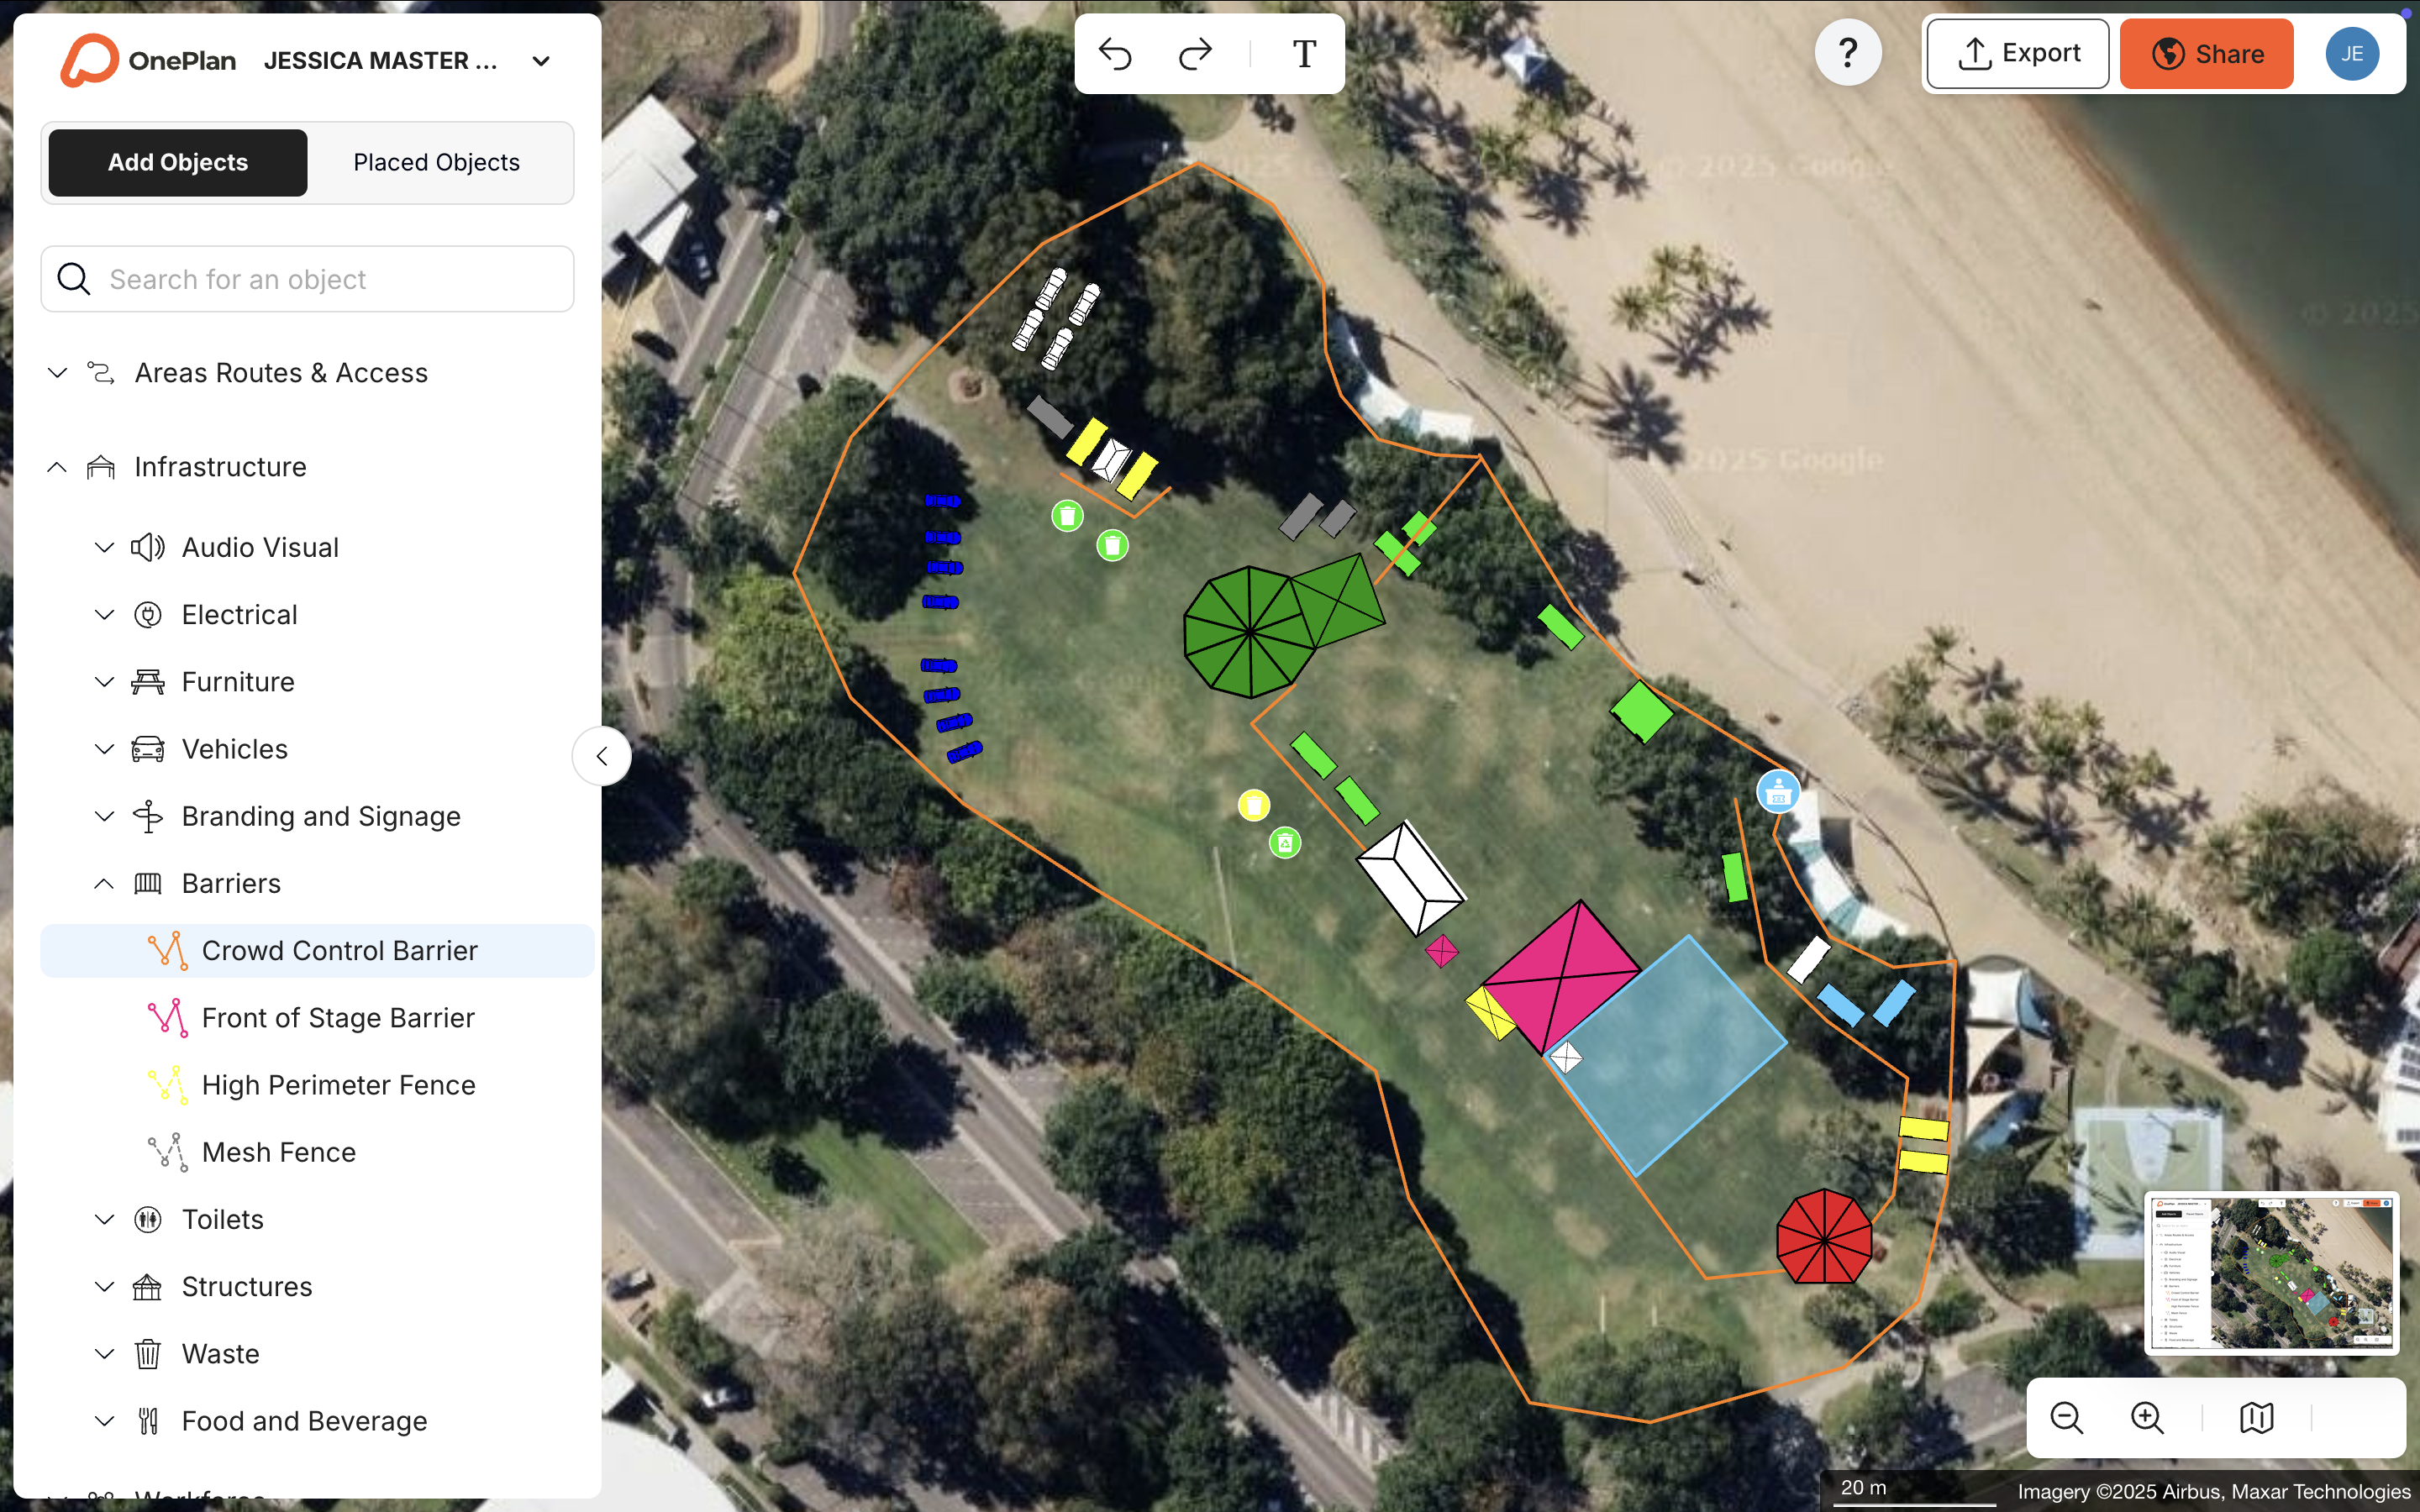
If you have existing floor plans, drone shots, or CAD-derived files, convert them to .png first. Then import them into OnePlan, scale them onto the map, and plan directly on top. South Fayette Township’s parks and recreation team noted that OnePlan’s satellite imagery was more current than what they had been using, with recent construction already reflected in the base map.
Want to see how a live base map behaves as you zoom and place objects? Start free with your first event or book a short demo to see it on your own streets.
Step 3: Outline the Footprint and Calculate Area and Perimeter
Draw the boundary of the event footprint once the live base map is in place. This boundary defines where the fair begins and ends, such as the closed street block, the park boundary, or the permitted area described in the road closure order.
OnePlan’s area and perimeter calculator returns the exact square footage and linear footage of any outlined shape instantly. This single number drives almost every downstream decision, including how many vendor booths fit, how much fencing to order, and whether the crowd capacity is achievable within the space.
Key decisions at this stage all flow from that calculated area:
- Subtract non-usable space such as stages, production compounds, emergency access lanes, and fixed infrastructure like fire hydrants, so you know what is actually available.
- Identify the net usable area for vendors and crowd zones separately, because each has different density and circulation needs.
- Confirm the perimeter measurement against the fencing or barrier quantity in your budget, which helps you catch over-ordering or shortfalls before procurement.
Bearfoot Productions uses OnePlan’s precise measurements to confidently order the right amount of fencing, including 8 km for a 10,000-capacity festival, without guesswork.
See how OnePlan’s area calculator works on your own street fair footprint. Start free today or book a 15-minute demo.
Step 4: Place Vendors, Stages, Barriers, Toilets, and Signage to Scale
The site map takes visible shape once you start placing objects. With OnePlan’s library of thousands of drag-and-drop event objects, you can place every element of the fair to scale on the live map, including vendor tents, food trucks, stages, crowd barriers, portable restrooms, generators, and signage.
Every object stays accurately sized as you zoom. Copy and paste lets you drop 20 evenly spaced vendor booths in seconds. TRC Events managed over 170 tents and exhibitors with precise scaling and placement down to the inch, and vendors “very much appreciate” being involved in the process.
Common trade-offs at this stage all involve balancing operational needs against safety and regulatory requirements:
- Vendor row width versus pedestrian aisle clearance. Accessible route continuity is often broken when vendor displays push into aisles, so mark minimum clear widths on the map and enforce them during setup.
- Stage orientation versus prevailing wind and sun angle, which affects performer comfort and crowd sightlines.
- Generator and power distribution placement relative to vendor rows and water sources, keeping noise and fuel away from food service.
- Toilet block placement that is close enough to be convenient yet far enough from food vendors to meet health code requirements. Requirements vary by jurisdiction, so confirm details with your local authority.
Want to see how quickly you can lay out vendor rows and infrastructure to scale? Try OnePlan free for your first event or book a demo to watch a layout come together live.
Step 5: Plan Crowd Areas, Standing Capacity, and Ingress-Egress Flow
Crowd safety sits at the center of any street fair site map. OnePlan’s 2026 Event Site Planning Report found that 71% of event professionals cite attendee safety and security as their top priority, and over 1 in 3 name crowd safety and flow as their single biggest challenge.
In OnePlan, you draw any crowd area on the map, select a standing density, and the crowd capacity calculator returns the safe standing capacity for that zone instantly. This method applies separately to stage viewing areas, vendor corridors, and entry plazas, not just the overall site. Calculating maximum safe occupancy for every zone of the event, not just the overall venue, is a recognized best practice in crowd management. Confirm thresholds with your local fire marshal.
For ingress and egress, OnePlan provides free arrival and exit calculators:
- The arrival calculator estimates queue length and queue time for ticket checks and security screening.
- The exit calculator uses exit width, crowd size, and flow rate to estimate exit capacity.
Emergency vehicle access roadways must provide a minimum of 15–20 feet of unobstructed width (per local fire codes) with 13 feet 6 inches vertical clearance and must stay clear at all times. Map these lanes explicitly so they remain visible to every stakeholder reviewing the plan. Follow your local fire authority’s requirements.
Try OnePlan’s crowd capacity tools on your next event. Your first event is free, or you can book a demo to see the calculators in action.
Step 6: Add Workforce Dots for Security, Medical, and Stewards
A site map that shows infrastructure but not people does not fully support permitting or operations. In OnePlan, you place workforce dots on the map for every role, including security personnel, medical staff, stewards, information volunteers, and supervisors. Each dot carries a name, shift times, notes, and equipment assignment.
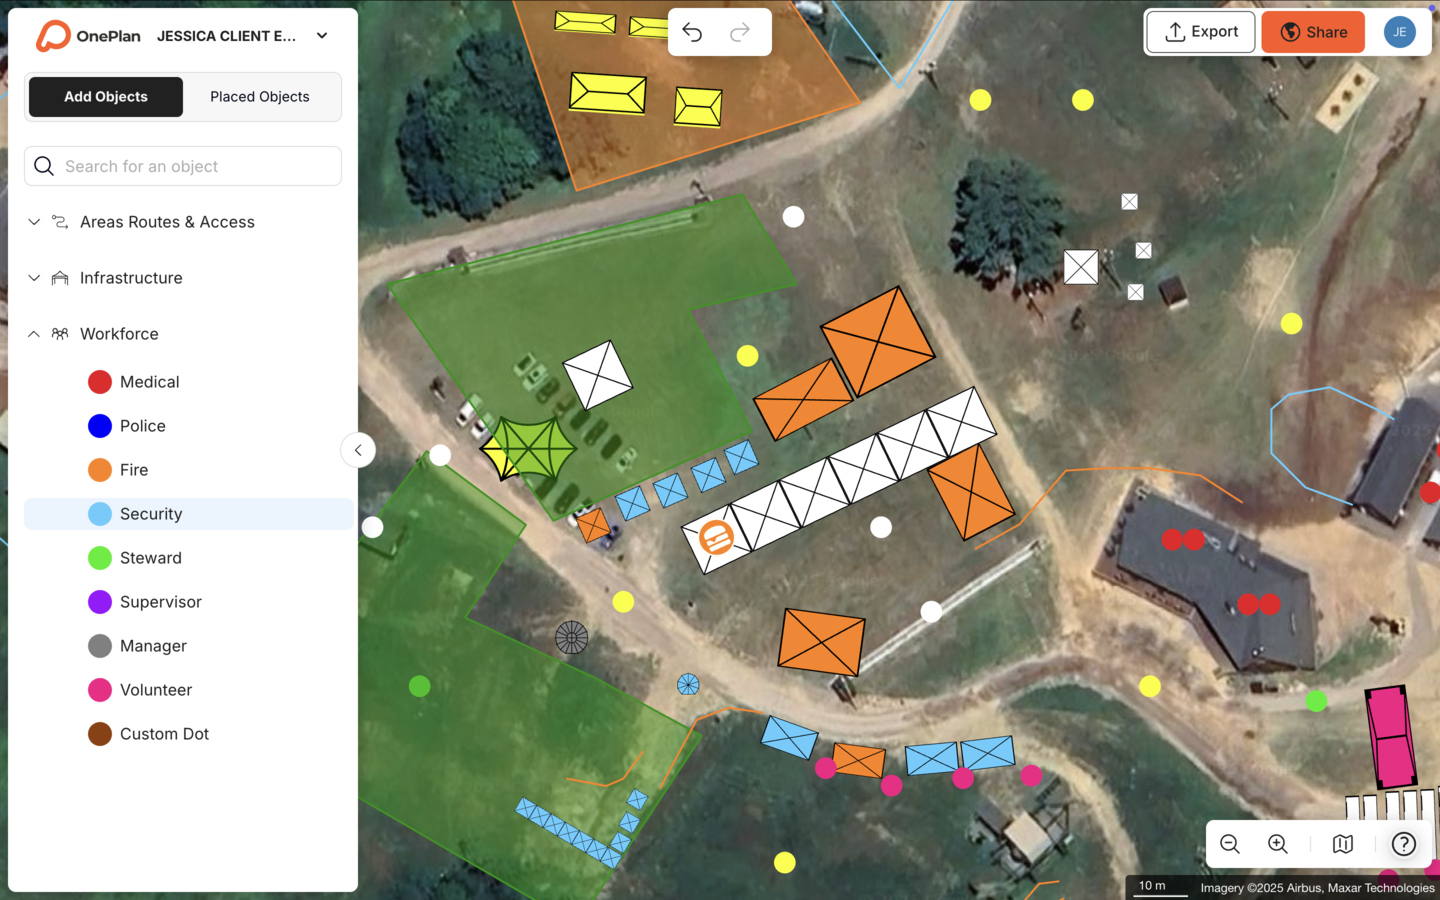
This step produces a staffing plan that is spatially accurate. Reviewers can see exactly where each person is posted relative to crowd zones, entry points, and vendor rows, instead of reading a disconnected spreadsheet. Green, Amber, and Red occupancy thresholds for each zone should be agreed in writing with police, fire services, and private security and written into the formal event safety plan before the event. Mapping staff positions against those zones makes that coordination straightforward. Confirm staffing ratios with your local authority.
With infrastructure, crowd zones, and workforce now mapped, the plan is complete and ready to share with every stakeholder. Start your first staffed plan free or book a demo to walk through workforce mapping step by step.
Step 7: Export High-Resolution Maps and Bills of Quantities
That finished plan needs to leave OnePlan in formats that work for every audience. Export a high-resolution PNG map, up to A0 and print-ready, for the permit application, the fire marshal review, and event-day printouts. The auto-generated Bill of Quantities exports to Excel or CSV as a structured inventory, with every object placed on the map tallied automatically and quantities calculated.
OnePlan’s Bill of Quantities tool automatically tallies items placed on a site map and calculates infrastructure needs for sourcing from suppliers, which removes the manual re-keying that usually turns a finished map into a procurement spreadsheet. That fencing quantity, such as the 8 km mentioned in Step 3, comes directly from the auto-generated Bill of Quantities. Silverstone uses the same tool to tell suppliers exactly how many barriers each area needs, cutting down the spreadsheets exchanged with its 9,000 contractors.
Need permit-ready exports and supplier-ready inventories from a single plan? Start free with OnePlan or book a demo focused on exports and Bills of Quantities.
Planning Tools Compared: Static Files, CAD, and OnePlan
Most street fair site maps are still built with tools that were never designed for the job. The table below compares the two most common approaches against a purpose-built workflow.
| Dimension | Manual tools (PowerPoint, Excel, Canva, Photoshop, Google Maps, static screenshots) | Complex engineering software (CAD, AutoCAD) | OnePlan |
|---|---|---|---|
| To scale on a live map | No | Yes | Yes |
| Easy to learn and start in seconds | Yes | No, steep learning curve | Yes |
| Real-time collaboration | No, emailed file versions | Limited | Yes, single live plan |
| Event-specific objects and Bill of Quantities | No | No | Yes |
| Cost to start | Low but limited | High, specialist required | Free first event |
The Cheese & Chilli Festival, which experienced scaling problems with its previous workflow, moved from Excel, PowerPoint, and Google Maps to OnePlan and now creates “accurate, detailed and professional-looking event site plans without the need for a complex CAD package.” Eagle Mountain City previously built layouts by taking a Google Maps screenshot and importing it into Publisher, a time-consuming process that could not support multi-stakeholder coordination. Those tool limitations lead directly to the operational problems most organizers face.
Curious how a purpose-built tool changes your own workflow? Start your first event free or book a demo tailored to your current tools.
Common Challenges in Street Fair Site Mapping
Even experienced organizers run into recurring problems when building street fair site maps. These challenges often stem from the tool choices just discussed and tend to appear together during planning and setup.
- Inaccurate layouts that fail on setup day. Static PDF site plans become inaccurate the moment a supplier moves equipment, leaving crews working from mismatched versions on site. A live, shared map that updates in real time keeps everyone aligned.
- Version chaos across departments. When security, public works, fire, and the events team each maintain their own copy of the plan, nobody works from the same picture. One shared plan in OnePlan replaces multiple emailed versions.
- Underestimated infrastructure quantities. Ordering too little fencing or too few portable restrooms creates on-site emergencies. The auto-generated Bill of Quantities counts every object placed on the map and reduces this risk.
- Stakeholder misalignment during permitting. Eagle Mountain City’s events manager previously had to create separate maps for fire, police, facilities, and other departments. A single comprehensive map shared across all stakeholders shortens approval cycles.
- ADA accessibility gaps discovered on event day. Accessibility problems at temporary events usually start in planning rather than on opening day. The aisle-width issue mentioned in Step 4 is a common example. Map the accessible path of travel before placing any vendor or stage.
Avoiding these challenges produces concrete, measurable improvements across the entire event lifecycle. Explore how OnePlan addresses each of these pain points in a short, live walkthrough.
Measuring Success from Your Street Fair Site Map
A well-built street fair site map, one that sidesteps the problems above, produces measurable outcomes before, during, and after the event.
- Fewer pre-event site visits required to verify measurements. The Beirut Marathon cut roughly 20 site visits a year down to two, showing how accurate maps reduce on-site checks.
- Smoother permit approvals because the submitted map matches what authorities expect to see, including access, capacity, and infrastructure details.
- Reduced last-minute revisions on setup day because layouts were validated to scale in advance and shared with suppliers.
- Accurate procurement quantities from the Bill of Quantities, which reduces over-ordering and emergency sourcing while keeping budgets predictable.
- Faster planning cycles year over year as templates are reused and refined, which brings you to the specific workflow considerations for events that repeat annually.
Want to benchmark your own outcomes against these metrics? Book a demo to review your current process or start your first event free and track the difference.
Advanced Considerations for Recurring Fairs and Multi-Year Templates
That year-over-year efficiency matters most for annual street fairs, including large-scale events like the Fargo Street Fair, the Folsom Street Fair, the U District Street Fair in Seattle, and the Gilman District events in Berkeley. These events face a specific planning challenge around carrying forward the institutional knowledge embedded in last year’s site map without starting from a blank page.
In OnePlan, a finished plan becomes a reusable template. You duplicate the plan for the next edition, update vendor assignments, and adjust for any changes to the street closure footprint. The base map, object library, and Bill of Quantities structure carry forward automatically. The recommended workflow for recurring outdoor events is to save the map after breakdown and duplicate it for next year, using notes made during the current event as the foundation for future planning.
For organizations running multiple fairs across a city or region, OnePlan supports standardized templates that keep emergency access lane widths, toilet ratios, and signage placement consistent across every event. This consistency reduces compliance risk that can arise when each team reinvents the plan independently.
The Joe Lewis Company reuses OnePlan maps year on year for high-profile events including the GRAMMYs, creating guaranteed “as-built” designs where “the map will speak for itself.”
Ready to turn this year’s fair into a template for the next one? Start with a free first event or book a demo focused on templates and recurring events.
Frequently Asked Questions
How far in advance should I start building a street fair site map?
For events requiring municipal permits such as road closures, temporary structure permits, and food vendor licenses, most city permitting offices expect applications 30 to 60 days before the event date, and many require a site map as part of that submission. Start building your map as soon as the street closure footprint is confirmed, even if vendor assignments are still pending. A footprint-and-zones map submitted early can be updated as details are finalized. Check with your local permitting office for exact deadlines, as requirements vary significantly by city and state.
Do requirements for street fair site maps differ by state or city?
Requirements differ significantly by jurisdiction. Some cities require site maps to show specific elements such as emergency access lanes, ADA-accessible routes, generator placement, and fire extinguisher locations, while others have more general requirements. California cities, for example, often have detailed Temporary Use Permit checklists that include traffic control plans and health department sign-offs for food vendors. Request the permitting checklist from your local authority before building the map so you know exactly what needs to be shown.
How do I update a street fair site map year over year without starting from scratch?
In OnePlan, you duplicate the previous year’s plan at the end of the event. The base map, all placed objects, and the Bill of Quantities structure carry forward into the new copy. You then update vendor assignments and adjust for any changes to the street closure boundary or infrastructure. The plan is ready for the next permitting cycle. This approach also preserves institutional knowledge, because the emergency access lane widths, toilet placement decisions, and crowd zone boundaries that took years to refine stay embedded in the template.
What is a Bill of Quantities and why does it matter for a street fair?
A Bill of Quantities is an auto-generated inventory of every object placed on the site map, including crowd barriers, tents, portable restrooms, generators, and signage, with quantities calculated automatically. For a street fair, it serves two purposes. It tells suppliers exactly what to deliver and where, and it gives the permitting authority a structured list of temporary structures and infrastructure. Without it, organizers typically re-key information from the map into a separate spreadsheet, which introduces errors and takes time. OnePlan generates the Bill of Quantities directly from the map with one click, and it exports to Excel or CSV.
Can a small team or first-time organizer use OnePlan to build a street fair site map?
A small team or first-time organizer can use OnePlan effectively. OnePlan is drag-and-drop and browser-based, so there is nothing to download or install, and no engineering background is required. Your first event is free, up to 25 objects, so a small team planning a single-block street fair can build and export a permit-ready map without spending anything. For larger or recurring events, paid plans start from around $75 per month. OnePlan Academy, a free online course, helps new users get up to speed quickly and provides a verified completion certificate. You can also book a short demo tailored to first-time organizers.
Conclusion: Start Building Your Street Fair Site Map Today
An accurate street fair site map is the document that gets your permit approved, guides your vendors into the right spots, keeps emergency lanes clear, and gives every stakeholder a shared picture of the event. The 7-step process above, from gathering site dimensions and choosing a live map base through placing objects to scale, calculating crowd zones, adding workforce positions, and exporting a permit-ready map and Bill of Quantities, replaces static PDFs and guesswork that cause last-minute problems on setup day.
OnePlan is the free-to-start, browser-based platform built for exactly this work. It has powered over 200,000 events in 150 countries, from single-block community fairs to the Olympics. Build your first street fair site map free, or book a demo to see how the 7-step process above works on your own event footprint.