
Written by: Paul Foster, Founder, CEO, OnePlan
Key Takeaways for Public Market Layouts
- A public market infrastructure placement map is a single, live, to-scale diagram that replaces outdated screenshots and emailed PDFs, reducing permitting delays and vendor confusion.
- The six-step process covers gathering site dimensions, outlining zones, placing stalls and utilities to scale, adding safety features, running capacity checks, and exporting deliverables.
- Accurate mapping supports permitting authorities, vendor coordination, and crowd safety across thousands of U.S. farmers markets and the many Americans who visit them each year.
- Specialized event site planning software outperforms manual tools and complex CAD packages by providing real-time collaboration, to-scale accuracy, and auto-generated Bills of Quantities.
- Book a demo with OnePlan to see how the platform simplifies public market infrastructure placement mapping and accelerates approvals.
Definition of a Public Market Infrastructure Placement Map
A public market infrastructure placement map is a geo-accurate, to-scale site diagram that shows the physical layout of every element in a temporary public market. It includes vendor stalls, power and water connections, pedestrian circulation routes, waste and sanitation stations, first-aid points, and emergency vehicle access corridors. A live placement map updates in real time and stays accurate at any zoom level, unlike a static screenshot or hand-drawn sketch.
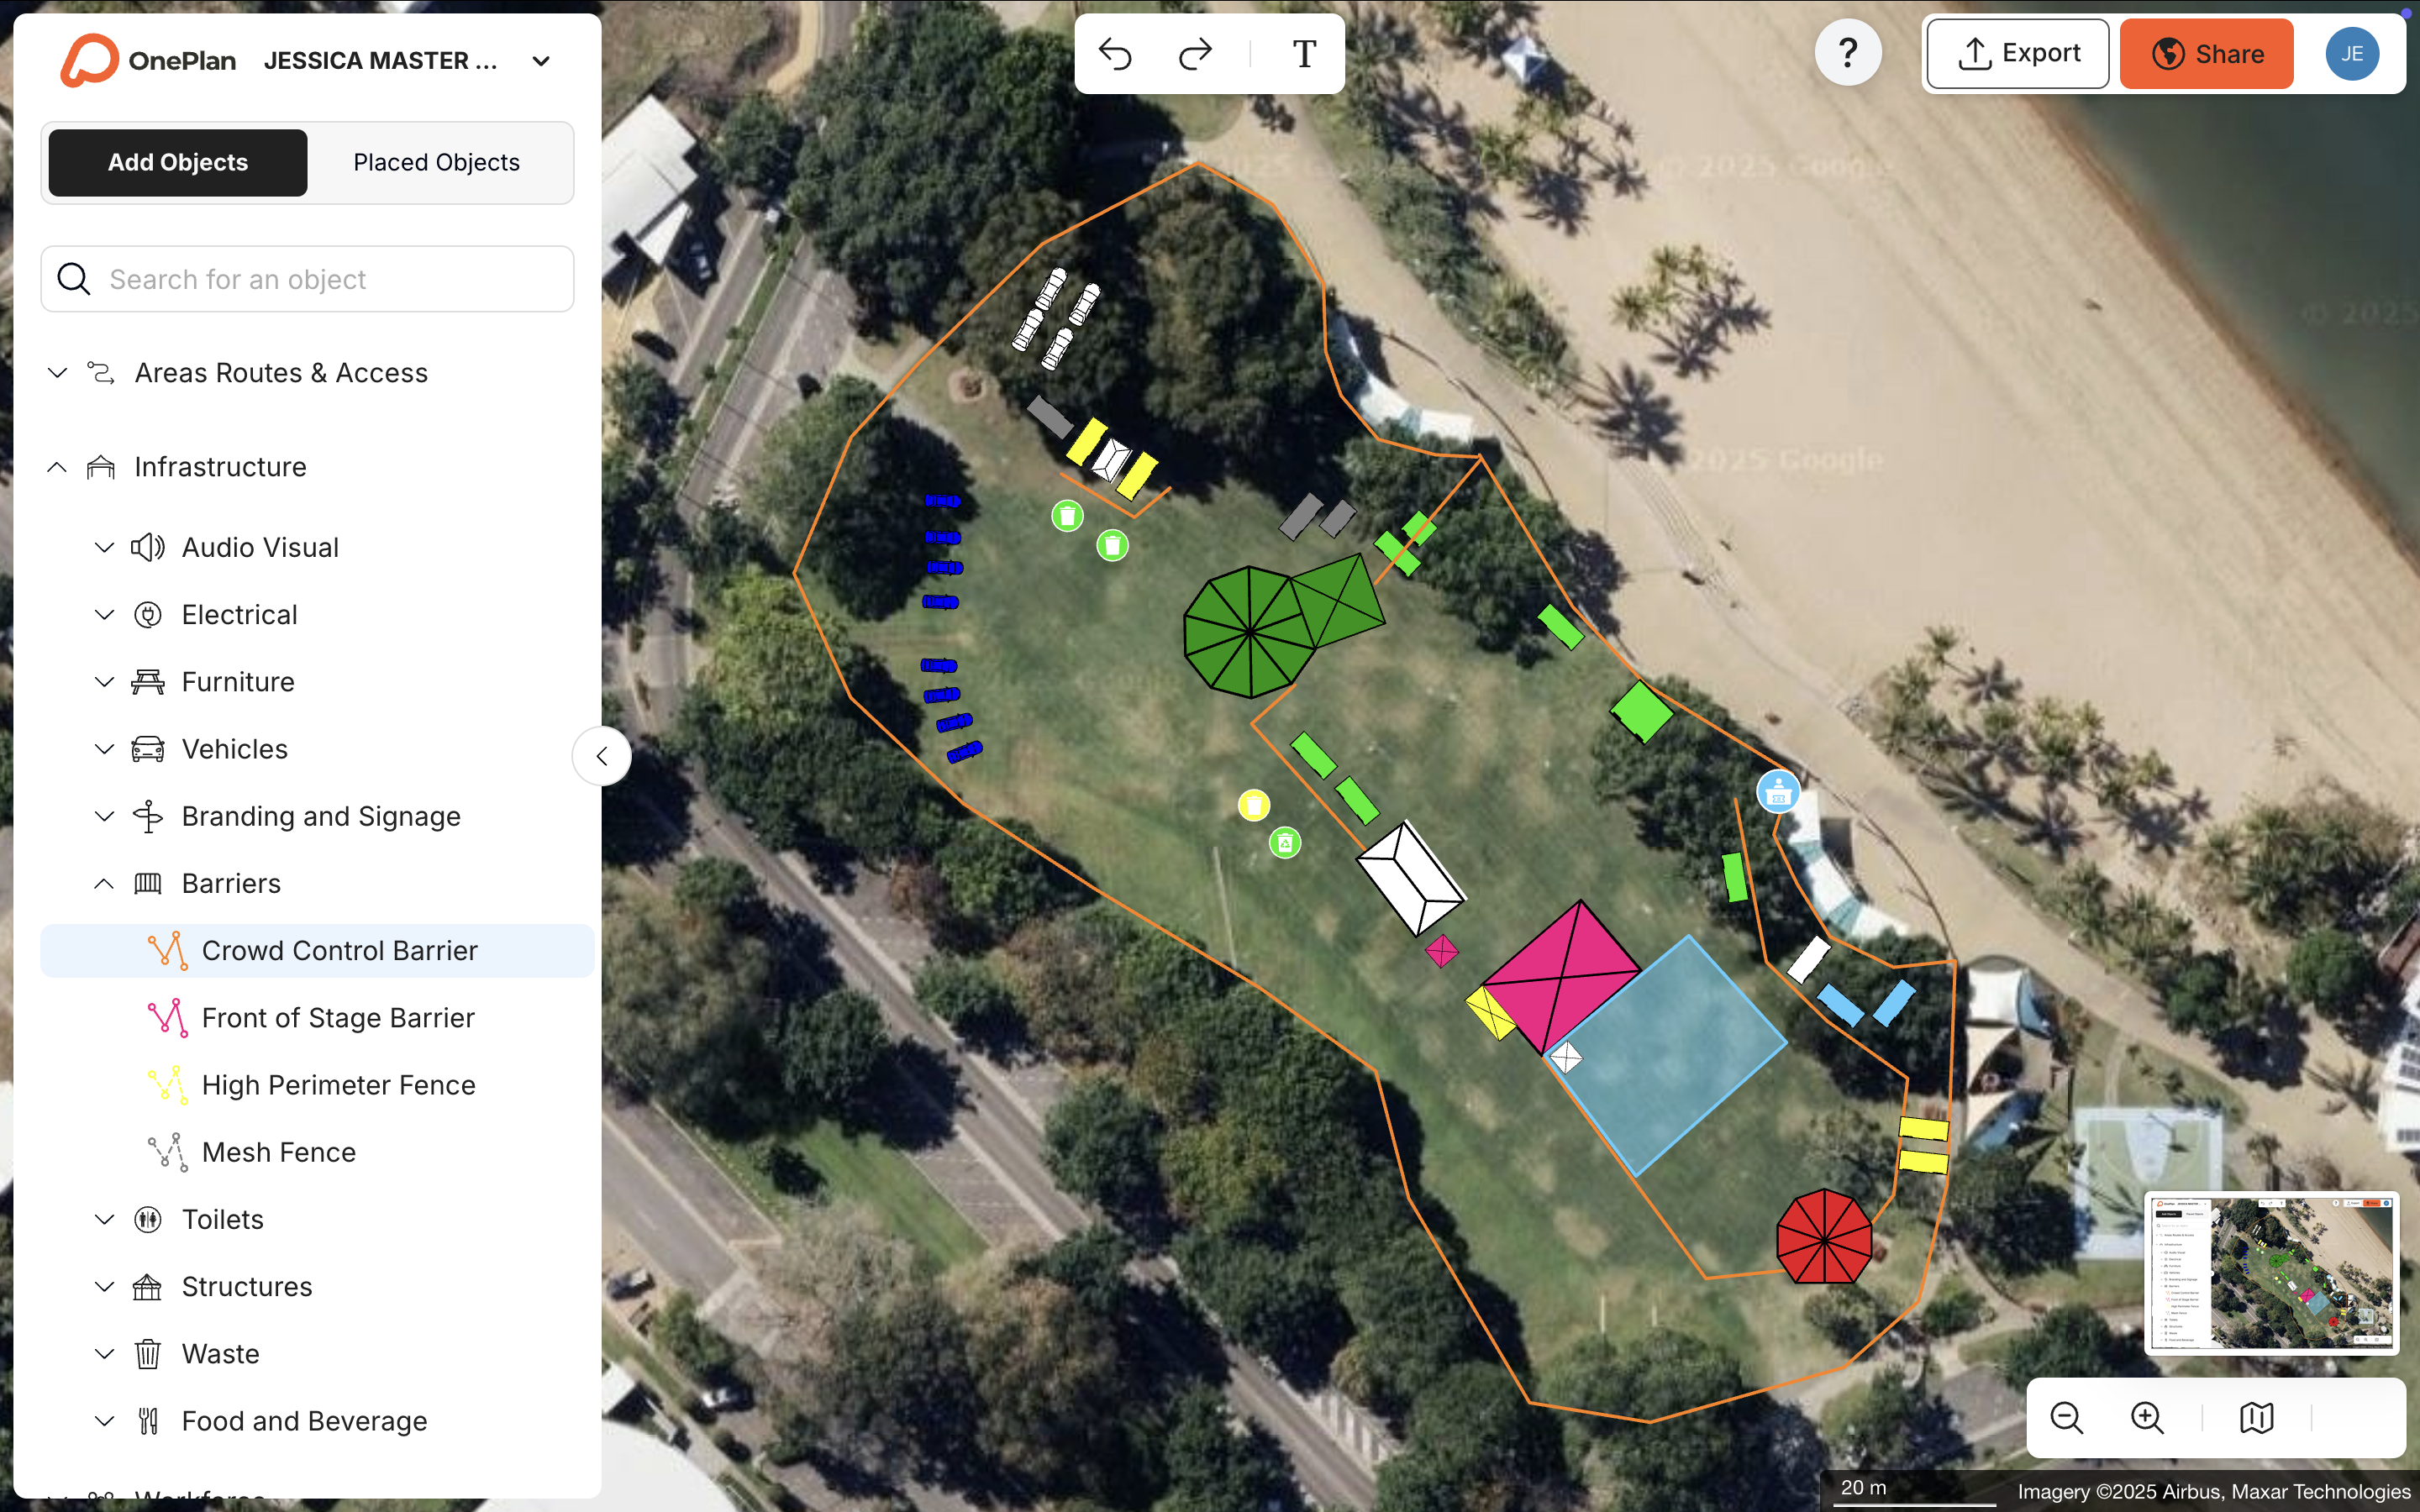
Accurate, collaborative mapping supports three core needs. Permitting authorities such as fire marshals, public works departments, and local zoning offices require a documented layout before approving a temporary use permit. Vendor coordination depends on every stall having a precise, numbered location that matches the physical site. Crowd safety relies on circulation paths and emergency routes being planned to scale before the first tent stake goes in the ground.
The scale of the need is significant. With over 7,000 active farmers markets nationwide and the vast majority of Americans visiting at least once per year, accurate site planning affects millions of market visits annually. According to OnePlan’s 2026 Event Site Planning Report, 71% of event professionals name attendee safety and security as their top priority when planning a site.
Core Elements of Public Market Infrastructure
Public market infrastructure covers every physical element that must be placed, connected, or designated before a market opens. The main categories are:
- Vendor stalls and trading structures, including tent footprints, canopies, and fixed booth frames, each sized to scale
- Utilities, including electrical hookups, water supply points, and drainage connections for food vendors
- Circulation paths, including main pedestrian aisles with a minimum 36 inches clear width for ADA compliance, secondary aisles, and loading lanes
- Waste and sanitation, including portable restrooms (with at least 5% ADA-accessible units), handwashing stations, and waste collection points
- Safety zones, including fire apparatus access roads, first-aid stations, and emergency vehicle corridors
ADA requirements and local fire-access codes apply to all of these elements. Confirm applicable requirements with your local authority having jurisdiction (AHJ) before finalizing any layout.
Functional Types of Public Market Infrastructure
Public market infrastructure divides into four functional types, and each type needs dedicated space on the placement map:
- Trading zones, including wet market sections such as produce, meat, and fish, and dry market sections such as crafts and packaged goods, which have different utility and drainage needs
- Service and back-of-house areas, including loading docks, cold storage, generator compounds, and vendor restocking paths kept separate from public circulation
- Emergency and safety routes, including dedicated fire apparatus access roads that remain unobstructed throughout the event; NFPA 1 fire code requirements apply to large outdoor assembly events regardless of their temporary status
- Utility corridors, including power distribution, water supply zones, and waste holding areas
Requirements vary significantly by jurisdiction. In California, for example, county environmental health departments set specific rules for food-vendor water supply and waste disposal that differ from neighboring states. Always verify local rules before finalizing zone boundaries. With these infrastructure categories and types in place, the next sections walk through a six-step process for creating a placement map that documents all of them accurately.
Step 1: Gather Site Dimensions and Constraints
Every accurate public market infrastructure placement map starts with verified measurements. The inputs at this stage are:
- Overall site boundary dimensions in feet, including length and width of the usable area
- Existing fixed features such as trees, light poles, fire hydrants, underground utilities, and permanent structures
- Access points such as vehicle entry gates, pedestrian entrances, and any adjacent road widths
- Ground conditions such as slopes, drainage patterns, and surface type, including asphalt, turf, or gravel
- Utility connection locations such as existing electrical panels, water mains, and sewer access
The key decision at this stage is whether to gather dimensions remotely using satellite imagery or to conduct a physical site survey. Remote measurement using a live map platform is faster and reduces site visits. A physical check still helps confirm underground utility locations and ground conditions that satellite imagery cannot capture.
The trade-off is time versus accuracy. Skipping the physical check risks placing a generator compound over a buried utility line or positioning a vendor row on a drainage slope. Before using a live map platform, the City of Greater Dandenong’s events team created site plans using Microsoft Word or PDFs with added symbols, which often featured outdated maps, non-scale layouts, and imprecise emergency location markings. These issues often start at the measurement stage.
In OnePlan, the area and perimeter calculator outlines any space and instantly returns its dimensions in square feet. Teams can validate site boundaries from the desk before committing to a site visit.
Step 2: Outline the Overall Footprint and Circulation Zones
With site dimensions confirmed, the next step is drawing the overall market footprint and designating the primary circulation zones before placing any individual stall or utility. The inputs are the boundary measurements from Step 1 and the expected vendor count and attendance estimate.
The decisions at this stage are:
- Where to position the main pedestrian entrance and exit points relative to parking and transit access
- How wide to make the main aisles, using a guideline that allocates space per vendor booth plus additional space for walkways, while local fire and ADA codes set minimum aisle widths that always take precedence
- Where to route the emergency vehicle access corridor so it connects to a public road without crossing the main pedestrian flow
- Where to locate the back-of-house service lane for vendor load-in and load-out, kept separate from public circulation
The trade-off here is vendor density versus crowd comfort and safety. Packing more stalls into the footprint increases revenue potential but reduces aisle widths, which can create bottlenecks and fail fire-access requirements. In New York City, for example, a Temporary Place of Assembly Certificate of Operation is required for outdoor events hosting 200 or more people when the venue lacks a valid Place of Assembly Certificate of Operation or for temporary structures. To-scale circulation plans support these approvals, although requirements vary by jurisdiction, so always verify with your local authority.
Drawing these zones to scale on a live map at this stage prevents the most common layout errors before a single stall is placed.
Step 3: Place Vendor Stalls and Service Infrastructure to Scale
With circulation zones established, vendor stalls, loading bays, restrooms, and first-aid stations can be placed to scale within the designated trading areas. This step involves the most detail and often reveals conflicts between planned and available space.
The inputs are the vendor roster, including stall sizes, power requirements, and product type, the utility connection locations from Step 1, and the zone boundaries from Step 2. Key placement decisions include:
- Grouping food vendors near water and power connections to minimize utility run lengths
- Positioning restroom clusters at the perimeter of the trading zone, accessible from main aisles but not blocking vendor frontage
- Placing the first-aid station at a central, visible location with direct access to the emergency vehicle corridor
- Assigning numbered stall positions that match the vendor coordination map sent to market participants
The trade-off is flexibility versus precision. Leaving stall positions approximate saves time in planning but creates conflicts on setup day when a 10×20-foot food truck tent does not fit the assumed space. As the Cheese & Chilli Festival found: “With the software we were using before, the ability to scale wasn’t great. We couldn’t rely on it to be accurate and we would often get to site and have to make changes to layout due to plans not being to scale.”
Below is a sample labeled layout showing the key elements of a public market infrastructure placement map at this stage:
- Trading rows, with numbered stalls arranged in parallel rows and main and secondary aisles between them
- Loading bay, positioned at the back-of-house perimeter and accessible from the service lane
- Restroom cluster, located at the east perimeter and including ADA-accessible units on a firm, level surface
- First-aid station, centrally located with direct sightlines to the main pedestrian entrance
- Pedestrian flow arrows, indicating primary circulation direction through the main aisle
- Emergency vehicle corridor, a clear, unobstructed 20-foot-wide lane running along the north perimeter
Step 4: Add Utilities, Waste, and Safety Features
With stalls and service infrastructure placed, the next step is overlaying the utility network, waste management points, and safety features onto the map. The inputs are the utility connection locations confirmed in Step 1 and the stall assignments from Step 3.
Elements to add at this stage include:
- Electrical distribution, including generator placement with fuel storage and management requirements under NFPA 1 and NFPA 30, cable routing, and individual vendor hookup points
- Water supply and drainage, including supply points for food vendors, handwashing stations, and drainage paths away from pedestrian areas
- Waste stations, including segregated collection points for general waste and recyclables, positioned at aisle ends for easy vendor and visitor access
- Fire safety markers, including fire extinguisher locations and the documented fire apparatus access road, kept clear of all infrastructure
- Signage points, including entrance, exit, restroom, and first-aid directional signs placed as points of interest on the map
The trade-off at this stage is thoroughness versus time. Documenting every utility run and waste point takes longer upfront but produces the evidence base that permitting authorities and health departments require. Confirm applicable utility and sanitation standards with your local AHJ before finalizing this layer.
Step 5: Run Crowd-Capacity and Traffic Checks
Before exporting any deliverables, use the placement map to run crowd-capacity and traffic flow checks across the key areas of the market. According to OnePlan’s 2026 Event Site Planning Report, over 1 in 3 event professionals name crowd safety and flow as their single biggest challenge.
The checks to run at this stage are:
- Standing crowd capacity, outlining each trading zone and calculating its safe standing capacity using a crowd capacity tool, which supports permitting documentation and on-the-day management decisions
- Aisle width verification, confirming that all main and secondary aisles meet the minimum clear widths required by local fire and ADA codes after stalls are placed to scale
- Emergency egress check, tracing every emergency exit route from the furthest point in the market to a public road and confirming that no infrastructure obstructs the path
- Vehicle access verification, confirming that the emergency vehicle corridor remains a clear, unobstructed lane wide enough for fire apparatus
For arrival and exit flow modeling, OnePlan’s free arrival calculator and exit calculator estimate queue length, queue time, and exit capacity based on crowd size, exit width, and flow rate. These figures provide useful inputs for documenting ingress and egress planning to permitting authorities.
The trade-off is the time spent on checks versus the risk of discovering a compliance issue on event day. The City of Greater Dandenong’s team noted that OnePlan’s measuring tool was invaluable for setting a safe exclusion zone for their New Year’s Eve fireworks, saving them from making numerous site visits or using inaccurate maps.
Step 6: Export Maps and Bill of Quantities for Approvals
The final step converts the completed public market infrastructure placement map into the deliverables that permitting authorities, vendors, and operational teams actually need. The outputs at this stage are:
- High-resolution site plan, a print-ready map export up to A0 size that shows all stalls, utilities, circulation paths, waste stations, and emergency routes, suitable for submission to fire marshals, public works departments, and zoning offices
- Bill of Quantities, an auto-generated inventory exported to Excel or CSV that lists every item placed on the map, including tents, barriers, restrooms, generators, and signage, with quantities for procurement and contractor coordination
- Vendor coordination map, a labeled version of the placement map that shows numbered stall assignments and is shared with market participants before setup day
- Stakeholder view links, secure, view-only links to the live plan so fire, police, and public works contacts always see the current version without anyone resending files
Bearfoot Productions used OnePlan’s Bill of Quantities to accurately calculate and order over 1,000 panels of Heras fencing and 1,500 pedestrian barriers, totaling about 8 kilometers of fencing. The same auto-generation capability applies directly to public market infrastructure procurement.
For recurring markets, saving the completed plan as a template means the next event starts from a verified baseline rather than a blank map. This approach compounds time savings across every market cycle.
Downloadable Public Market Infrastructure Placement Map Checklist
Use this checklist to confirm every element is documented on the placement map before submitting for permits or sharing with vendors:
- Site boundary dimensions verified and drawn to scale
- All vendor stalls numbered, sized to scale, and assigned to named vendors
- Main and secondary aisle widths confirmed against local ADA and fire code minimums
- Electrical hookup points and generator location marked, with fuel storage noted
- Water supply points and drainage paths documented for food vendors
- Restroom cluster locations shown, including ADA-accessible units on firm, level surfaces
- Waste and recycling collection points placed at aisle ends
- First-aid station positioned centrally with clear sightlines to the main entrance
- Emergency vehicle access corridor marked as a named, unobstructed route connecting to a public road
- All emergency exits traced and confirmed clear of infrastructure
- Directional signage points added for entrances, exits, restrooms, and first aid
- Standing crowd capacity calculated for each trading zone
- Bill of Quantities exported and reviewed against procurement requirements
- High-resolution map exported and ready for permitting submission
Manual Tools vs. Specialized Software for Market Maps
The table below compares the three approaches most local-government events teams use to create a public market infrastructure placement map. Every data point reflects documented outcomes from published sources.
| Tool Type | Accuracy | Collaboration | Cost |
|---|---|---|---|
| Manual tools (PowerPoint, Excel, Google Maps screenshots) | Not to scale; layouts require on-site corrections because plans cannot be relied upon to be accurate | Files emailed back and forth, version control becomes difficult, and departments maintain separate maps | Low upfront cost, with high hidden cost in rework, extra site visits, and permitting delays |
| Complex engineering software (CAD, AutoCAD) | High precision, built for engineers rather than events teams | Limited real-time collaboration, and contracting a CAD designer adds cost and turnaround time | High licensing cost plus specialist labor, with a steep learning curve for non-engineers |
| OnePlan (specialized event site planning software) | To scale on a live satellite map, and delivers accurate, detailed, and professional-looking event site plans without the need for a complex CAD package | Real-time collaboration on one live plan, with secure view-only links for permitting authorities and vendors | First event free with up to 25 objects, with paid plans from approximately $75 per month per seat |
How OnePlan Simplifies Public Market Planning
OnePlan is a browser-based platform where city events coordinators and market managers drag and drop to-scale objects such as vendor tents, portable restrooms, generators, crowd barriers, and signage directly onto a live satellite or street map. There is nothing to download or install, and no engineering background is required.
The features most relevant to a public market infrastructure placement map are:
- To-scale drag-and-drop objects, so every item placed on the map stays accurate at any zoom level and a 10×10-foot vendor tent remains exactly that size relative to the site
- Import existing layouts, converting existing PDFs, site plans, or CAD-derived files to .png and importing them as a base layer to plan on top of
- Auto-generated Bill of Quantities, exporting every object placed on the map automatically to Excel or CSV for procurement and permitting
- Crowd capacity calculator, outlining any trading zone and instantly calculating its safe standing capacity
- Real-time collaboration, allowing multiple team members, vendors, and authority contacts to work from one live plan instead of separate emailed versions
Eagle Mountain City, Utah, cut event planning time from 8–10 hours down to a few hours per event and reported a 5× ROI after switching to OnePlan. Events Manager Dawn Hancock described the shift: “Gone are the days of creating separate layouts for fire, police, facilities, and other departments. Now I can create a single, all-encompassing layout.” OnePlan has powered 200,000 events in 150 countries, from local community markets to the Paris 2024 Olympic Games.
Frequently Asked Questions
How long does it take to build a public market infrastructure placement map in OnePlan?
Most market managers complete a first draft of a public market infrastructure placement map within a few hours, including stall placement, utility markers, and emergency routes. Recurring markets benefit from reusable templates, so subsequent events start from a verified baseline and take significantly less time. Eagle Mountain City reduced planning from 8–10 hours to a few hours per event after building their first template.
Can I import an existing site plan or CAD file into OnePlan?
Yes. Convert any existing PDF, site plan, drone photo, or CAD-derived file to a .png file first, then import it into OnePlan, scale it onto the live map, and plan directly on top of it. This approach means teams do not need to start from scratch, and existing layouts become reusable base maps that can be updated each market cycle.
How does OnePlan support permitting and safety documentation for public markets?
OnePlan exports high-resolution, print-ready maps up to A0 size and auto-generated Bills of Quantities in Excel or CSV format. These outputs are suitable for submission to fire marshals, public works departments, and local zoning offices. Secure, view-only links let permitting contacts access the live plan directly, so they always see the current version. Always confirm the specific documentation requirements with your local authority having jurisdiction before submitting.
Does OnePlan work for markets of different sizes?
OnePlan is used for events ranging from small community fairs to the Paris 2024 Olympic Games. The same drag-and-drop tools and calculators apply whether a market has 20 vendor stalls or 200. The first event is free with up to 25 objects, which makes it practical to start with a small market and scale up as needed. Paid plans start from approximately $75 per month per seat.
Can multiple departments work from the same plan?
Yes. OnePlan is built as a single source of truth. Multiple team members and external stakeholders can view and edit the same live plan simultaneously. Secure, password-protectable share links mean each department or authority contact accesses the plan without anyone needing to resend files or manage version conflicts.
Conclusion: Safer, Faster Public Market Planning
A public market infrastructure placement map built through a repeatable six-step process, including gathering dimensions, outlining zones, placing stalls and utilities to scale, adding safety features, running capacity checks, and exporting deliverables, replaces the guesswork of static screenshots and emailed PDFs with a single, permitting-ready document that every stakeholder can trust. The result is faster approvals, better vendor coordination, and safer markets. Get started free at OnePlan, where your first event is on us, or book a 15-minute demo to see OnePlan in action.