
Written by: Paul Foster, Founder, CEO, OnePlan
Key Takeaways for Parade Street Closure Maps
- Accurate, live parade street closure maps remove version-control chaos and give traffic, police, fire, and permitting teams one shared source of truth.
- Start by collecting route details, timing, participant numbers, and every authority that must sign off before you draw a single line.
- Use a geo-accurate, zoomable map base instead of static screenshots so every cone, barrier, and closure stays correctly scaled.
- Draw the full route, mark all closed streets and intersections, add emergency access points, and place cones, barriers, and signage on the plan.
- OnePlan streamlines the workflow from mapping through export of permit-ready documents, and you can book a demo today to see the process in action.
Step 1: Define Route, Timing, and Authority Requirements Up Front
The objective of this step is to define every constraint before you draw any lines. Collect the proposed parade route as a written description or rough sketch, the event start and end times, the expected number of participants and spectators, and the names of every authority that must sign off, typically the city or county DOT, police department, fire marshal, and parks department.
Key decisions at this stage include the direction of travel, staging and dispersal locations, and whether any intersections require full closure versus flagging. These choices directly affect your next decision, which is how to balance the most direct route for participants against minimizing disruption to arterial roads. Once you have mapped these trade-offs, confirm whether your jurisdiction requires a traffic-control plan as a separate document or accepts it as part of the event map, because this determines the format of your final deliverable. Requirements differ significantly between, for example, a Texas municipality and a California city.
Step 2: Select a Live Map Base and Lock in Scale
A static screenshot from Google Maps or an exported PDF does not function as a working map base, because it cannot be updated, shared live, or measured accurately. The objective here is to select a geo-accurate, zoomable map base that keeps every object placed on it correctly scaled as you zoom in and out.
Options include satellite imagery, street maps, or HD aerial maps. For parade planning, a street-map base is often clearest for showing road names, intersection geometry, and sidewalk widths. Set your working scale before placing any objects. Confirm the width of the parade corridor in feet, the length of the full route, and the dimensions of any staging or dispersal areas. Pont3 uses HD map integration to create centimeter-accurate plans for road events near the Sydney Harbour Bridge and Opera House, and their operations director reports that OnePlan’s tools are easy to use and increase efficiency enough to support more profitable events. This shows what a precise, live map base makes possible even in complex urban environments.
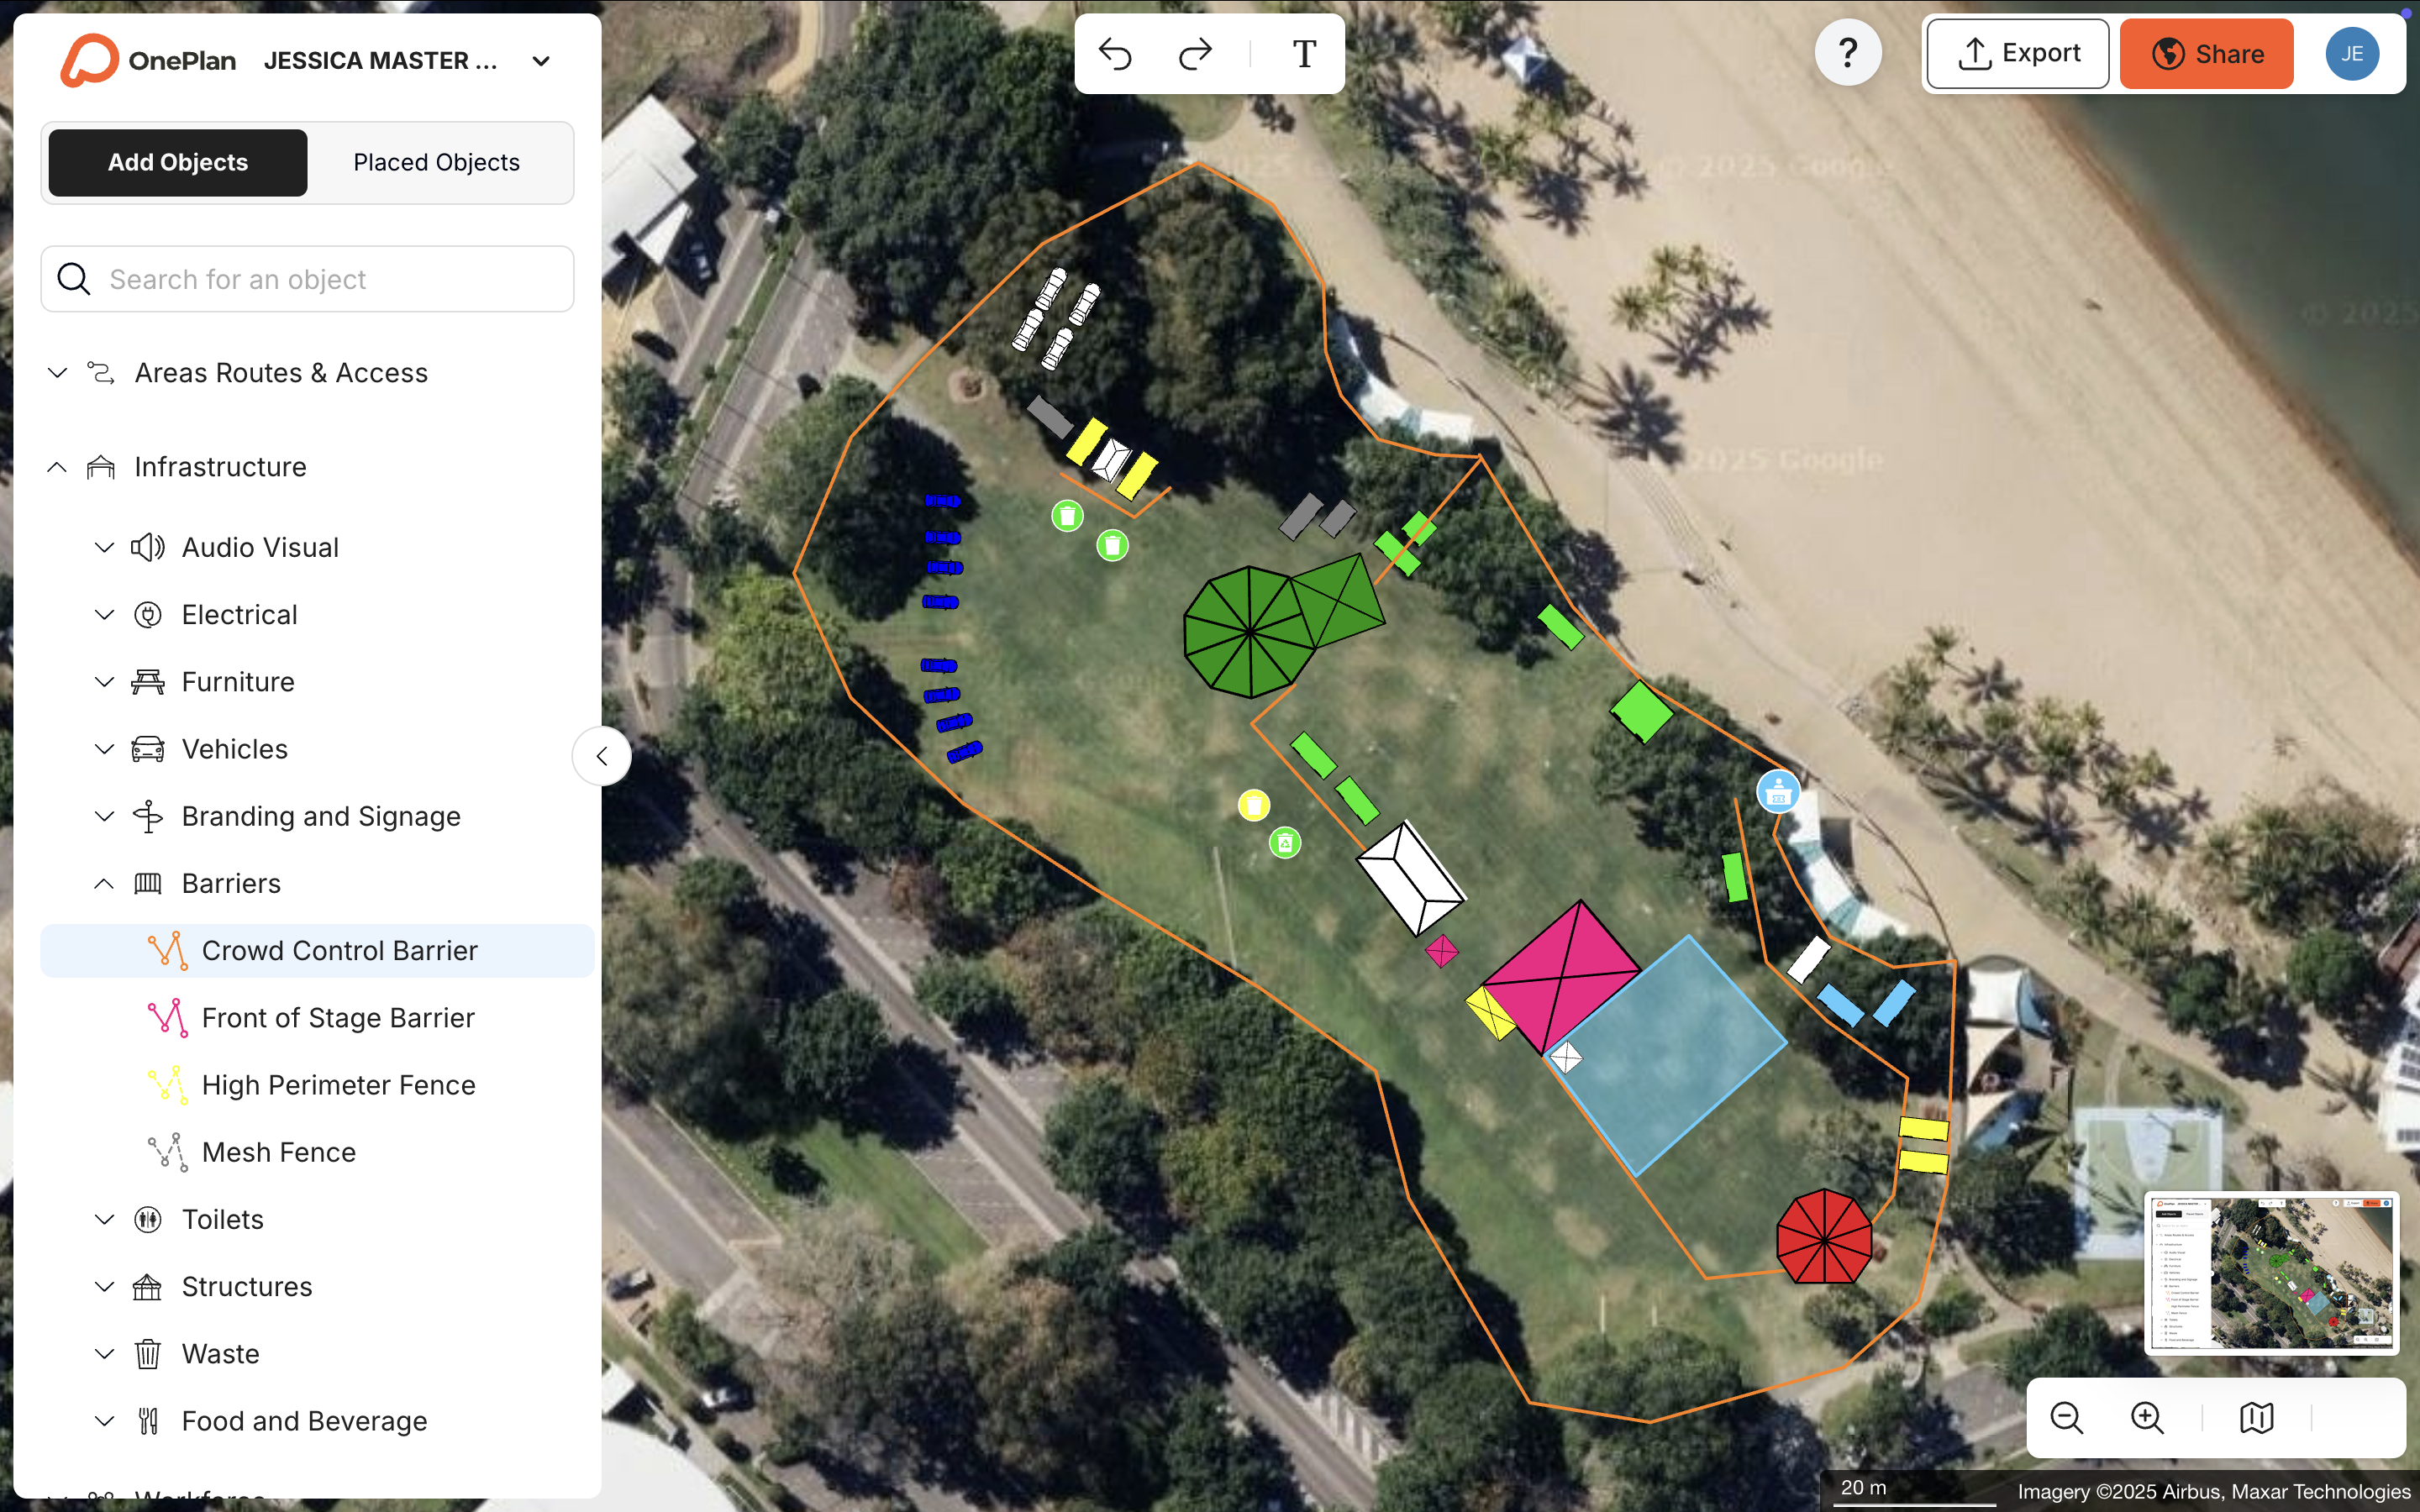
Step 3: Map the Parade Route, Closures, and Access Points
This step creates the core of your closure plan. Draw the full parade route as a line on the map, then outline every street segment that will be fully closed to traffic. Mark each closed intersection individually, and place access-point icons at every location where emergency vehicles, parade marshals, or authorized vehicles can enter or exit the closure zone.
Required inputs include the confirmed route, the list of cross streets, and the locations of any staging areas, reviewing stands, or dispersal zones. Key decisions include how far back from the parade corridor to extend closures at each intersection, and where to place pedestrian crossing points for spectators. A common trade-off appears between a wider closure perimeter, which improves safety, and the number of detour routes that must be signed and staffed.
Label every closed segment clearly with the street name and closure direction. Mark one-way detour routes with directional arrows. Place emergency-access icons at every point where first responders must be able to enter the closure zone without delay.
See how OnePlan handles route mapping and emergency access planning in a 15-minute walkthrough, or start your first event free.
Step 4: Place Cones, Barriers, Vehicle Access, and Parking Controls
With the route and closures drawn, you now populate the map with the physical infrastructure that enforces them. Place cone lines at every closure point, crowd barriers along the parade corridor where spectator areas adjoin the route, and vehicle-access gates at authorized entry points. Mark any temporary no-parking zones along the route and near staging areas.
Required inputs include your jurisdiction’s standard cone spacing, typically one cone every 10–20 feet on a taper, although local traffic-control manuals govern this, so confirm with your state or city DOT. You also need the type and length of crowd barriers, and the locations of any temporary signage. Stadium, a security and traffic-management firm, used OnePlan to plan Coventry Moves, an event with over 400 individual road closures across 7 procession routes and 110 stakeholders, and cut the time to produce eight traffic-management maps from a full day in CAD to about 2 hours. Their National Operations Manager noted that placing a road sign in PowerPoint took 5–10 minutes per sign, while the same task in OnePlan takes under a minute.
A common trade-off at this step is between placing barriers continuously along the full corridor, which maximizes crowd separation, and leaving sufficient pedestrian crossing gaps for spectator flow between viewing areas.
Step 5: Calculate Crowd Capacity and Flow Around Closures
Safe spectator capacity and realistic arrival and exit times form the backbone of both safety planning and permit documentation. Outline each designated spectator area on the map and use a standing crowd capacity calculator to determine safe occupancy for that space.
For arrival and exit flow, use OnePlan's free arrival calculator and exit calculator. The arrival model estimates queue length and queue time based on ticket-check and security-screening throughput. The exit model uses exit width, crowd size, and flow rate to estimate exit capacity. Running both calculations before you finalize your closure map helps you identify bottlenecks, such as a spectator zone that empties through a single 10-foot gap, and adjust the layout before it becomes a day-of problem.
Key decisions include how many exit points to designate per spectator zone and whether phased dispersal is needed for large crowds. Always follow the guidance of your local authority and relevant safety bodies when you set capacity limits. OnePlan's calculators support your planning and documentation, but final capacity decisions rest with the responsible authorities.
Step 6: Export Permit-Ready Maps and Bills of Quantities
With your route, closures, infrastructure, and capacity calculations complete, you now prepare permit-ready documentation. A finished map only delivers value when you can share it in the right format with the right people. Export a high-resolution, print-ready map, up to A0 size, for submission to permitting authorities. Export a separate Bill of Quantities as an Excel or CSV file listing every object placed on the map, including cone count, barrier segments, signage pieces, and access gates. This turns the map directly into a procurement and contractor-briefing document without any re-keying.
Share a live, view-only link with police, fire, public works, and any other stakeholders who need to review the plan. Because the link reflects the current state of the map, every recipient always sees the latest version, and you avoid emailing updated PDFs and hoping everyone opens the right attachment. As demonstrated earlier with Pont3’s Sydney Harbour work, sharing live plans with stakeholders removes version-control issues and speeds up approvals.
Watch a live demo of OnePlan's export and stakeholder-sharing features, or create your first permit-ready map at no cost.
Choosing Tools and Evaluating Mapping Approaches
Most parade street closure maps are still produced in one of two ways. Teams either build them manually in PowerPoint, Excel, Canva, Photoshop, Google Maps, or internal static, top-view screenshots and plan files, or they rely on CAD software operated by a specialist. Neither approach serves a modern event team well.
Manual tools are fast to open but produce plans that are not to scale, cannot be edited collaboratively in real time, and fragment into multiple emailed versions as soon as a second stakeholder gets involved. CAD tools are accurate but expensive, require specialist training, and produce outputs that are difficult for non-technical stakeholders such as police liaisons, parks staff, and permit officers to read and act on quickly.
When you evaluate any mapping approach for parade street closures, apply these criteria:
- Accuracy: Does every object sit to scale on a geo-accurate map base?
- Version control: Does one live plan exist, or do multiple versions circulate by email?
- Stakeholder accessibility: Can police, fire, DOT, and operations teams all view the same current map without specialist software?
- Export quality: Does the tool produce print-ready, high-resolution maps and structured inventory lists suitable for permit submission?
- Reusability: Can the plan be stored and adapted for next year's event without starting from scratch?
Common Parade Mapping Challenges and Fixes
Inaccurate layouts. When maps are built on screenshots rather than live geo-accurate bases, distances and object sizes become guesswork. Mitigation: use a map base that keeps all objects to scale at every zoom level, and validate key measurements such as corridor width and intersection geometry against the area and perimeter calculator before you finalize.
Version-control chaos. Emailed PDFs multiply quickly once multiple departments become involved. Mitigation: maintain one live plan and share it through a view-only link rather than static file attachments, so every recipient sees the current version automatically.
Stakeholder misalignment. Police, fire, public works, and the event organizer each building their own map creates contradictory plans on event day. Mitigation: establish a single source of truth from the first planning session and bring all departments into the same plan instead of reconciling separate documents later.
Underestimated infrastructure needs. Ordering too few barriers or cones is a common and costly error. Mitigation: use an auto-generated Bill of Quantities that counts every object placed on the map, so procurement figures come directly from the plan rather than from a separate estimate.
How to Measure Success for Parade Street Closures
A well-executed parade street closure map workflow produces measurable improvements across the planning cycle:
- Fewer revision cycles: Permit authorities request fewer follow-up changes when the submitted map is to scale, clearly labeled, and accompanied by a structured inventory.
- Faster approvals: Departments that can view a live, self-explanatory plan respond more quickly than those waiting for a PDF to be emailed and explained.
- Reduced last-minute changes: Crowd-flow and capacity calculations done at the mapping stage catch bottlenecks before event day rather than during setup.
- Stronger cross-department alignment: When police, fire, traffic, and operations all work from the same map, day-of briefings are shorter and conflicts are rarer.
Advanced Parade Planning Strategies
Reusable templates. A parade that runs on the same route every year does not need to be rebuilt from scratch each time. Save the base plan and update only what changes, such as new vendor locations, revised barrier counts, or adjusted closure times, rather than starting over.
Multi-event standardization. Organizations that run parades or processions across multiple cities benefit from standardized templates that enforce consistent closure geometry, signage placement, and safety-zone dimensions across all locations. The Tour of Britain, an 8-stage national race covering 1,352 km, uses OnePlan to keep infrastructure consistent across every stage, with plans ready six months in advance as a living plan until race day.
Frequently Asked Questions About Parade Street Closures
What streets are closed for Macy's parade?
The Macy's Thanksgiving Day Parade route in New York City typically runs from 77th Street and Central Park West, south along Central Park West to Columbus Circle, then east along Central Park South to Sixth Avenue, and south on Sixth Avenue to 34th Street. Specific street closures, timing, and detour routes are published annually by the New York City Department of Transportation and the NYPD. Check the official NYC DOT website or the NYPD's event-day advisories for the current year's confirmed closure list, because details change each year.
What is the Macy's parade route map?
The official Macy's Thanksgiving Day Parade route map is released each year by the event organizers and the City of New York. It shows the full 2.5-mile route from the Upper West Side to Macy’s Herald Square at 34th Street, including balloon inflation areas, viewing zones, and street-closure boundaries. The most current version is available through the Macy's parade website and NYC's official event pages.
What streets are closed in NYC today?
Current street closures in New York City are listed on the NYC Department of Transportation's online closure map and the NYPD's special-events page. For real-time updates on event-related closures, the NYC 311 service and the city's official social media channels also publish day-of advisories. Closure information changes frequently, so always check the official sources on the day of travel.
How do I get a permit for a parade street closure?
Permit requirements vary by city and state. In most U.S. jurisdictions, a parade permit application is submitted to the city or county special-events office, which coordinates review with the DOT, police department, fire marshal, and parks department. Applicants typically need to provide a proposed route, event date and times, estimated attendance, a traffic-control plan, and proof of liability insurance. For example, in California, many cities require a traffic-control plan stamped by a licensed traffic engineer. Always confirm requirements with your specific local authority well in advance of the event date.
What should a parade street closure map include?
A complete parade street closure map should include the full parade route with direction of travel marked, every closed street segment and intersection labeled by name, emergency-vehicle access points, pedestrian crossing locations, cone and barrier placement, detour routes with directional signage, staging and dispersal areas, and spectator zones with capacity notes. For permit submission, the map should be to scale, print-ready at high resolution, and accompanied by a structured inventory of all traffic-control equipment required.
Conclusion: Turning Your Parade Map into a Safety Plan
A parade street closure map functions as more than a formality. It serves as the operational document that keeps participants, spectators, and the surrounding community safe, and as the primary artifact that permitting authorities use to approve or reject an event. Building that map on a live, geo-accurate base, populating it with to-scale infrastructure, running crowd and flow calculations before event day, and sharing one live version with every stakeholder removes the version-control, accuracy, and coordination failures that affect teams still working from static PDFs and scattered city advisories.
The six-step workflow above applies to any parade, procession, or road-closure event regardless of scale or location. The tools and approach stay the same whether the event covers three city blocks or seven procession routes across an entire urban center.