
Written by: Paul Foster, Founder, CEO, OnePlan
Key Takeaways
- Calculate standing crowd capacity by dividing usable floor area in square feet by the square feet per person for your layout type, after subtracting non-usable space.
- Apply a 10–25% safety buffer after determining raw capacity to account for uneven crowd distribution and satisfy permitting requirements.
- Subtract non-usable areas such as stages, vendor units, aisles, restrooms, and infrastructure before applying the capacity formula to avoid overestimating attendance.
- Spreadsheets are error-prone for capacity planning, while professional mapping tools provide accurate, defensible figures by tying numbers to to-scale layouts.
- OnePlan’s crowd capacity calculator automates these calculations on a live map, and you can see it in a short demo to understand how it streamlines event planning.
Core Formula and Standing Layout Table
Standing crowd capacity relies on a simple formula that you can apply to any space.
Usable Area (sq ft) ÷ Square Feet Per Person = Maximum Standing Capacity
Once you have a capacity figure, you also need to understand how people move through the site. OnePlan’s arrival and exit calculators (available free at calculators.oneplan.io/arrival and calculators.oneplan.io/exit/calculator) estimate queue length, queue time, and exit flow so you can model the full ingress and egress picture before gates open.
The square feet per person figure depends on how densely you plan to fill the space. A loose, comfortable standing reception feels very different from a tightly packed festival floor, and that difference has real safety implications. The table below shows how square footage per person varies by density level and use case, so you can select the right benchmark before you apply the formula.
| Standing Layout Type | Sq Ft Per Person (Range) | Typical Use Case | Density Feel |
|---|---|---|---|
| Loose standing / networking | 10–15 sq ft | outdoor receptions, community fairs | Comfortable, easy movement |
| General standing crowd | 6–10 sq ft | festivals, markets, road race finish areas | Moderate, some flow |
| Dense standing crowd | 4–6 sq ft | concert floors, stadium standing sections | Tight, limited movement |
| Crush / maximum density | 2–4 sq ft | emergency planning reference only | Unsafe for sustained use |
Treat the crush or maximum density row as a ceiling for emergency modeling, not as a planning target. For most permitted events, the general or loose standing ranges provide the right starting point before you apply buffers. Requirements vary by jurisdiction, so confirm your chosen density with your local authority, fire marshal, or permitting body.
Once you select a target density from the table above, the formula gives you a raw capacity number. That number still needs two more steps before it becomes usable: subtracting non-usable space and applying a safety buffer. See this formula applied on a live map in a 15-minute OnePlan walkthrough.
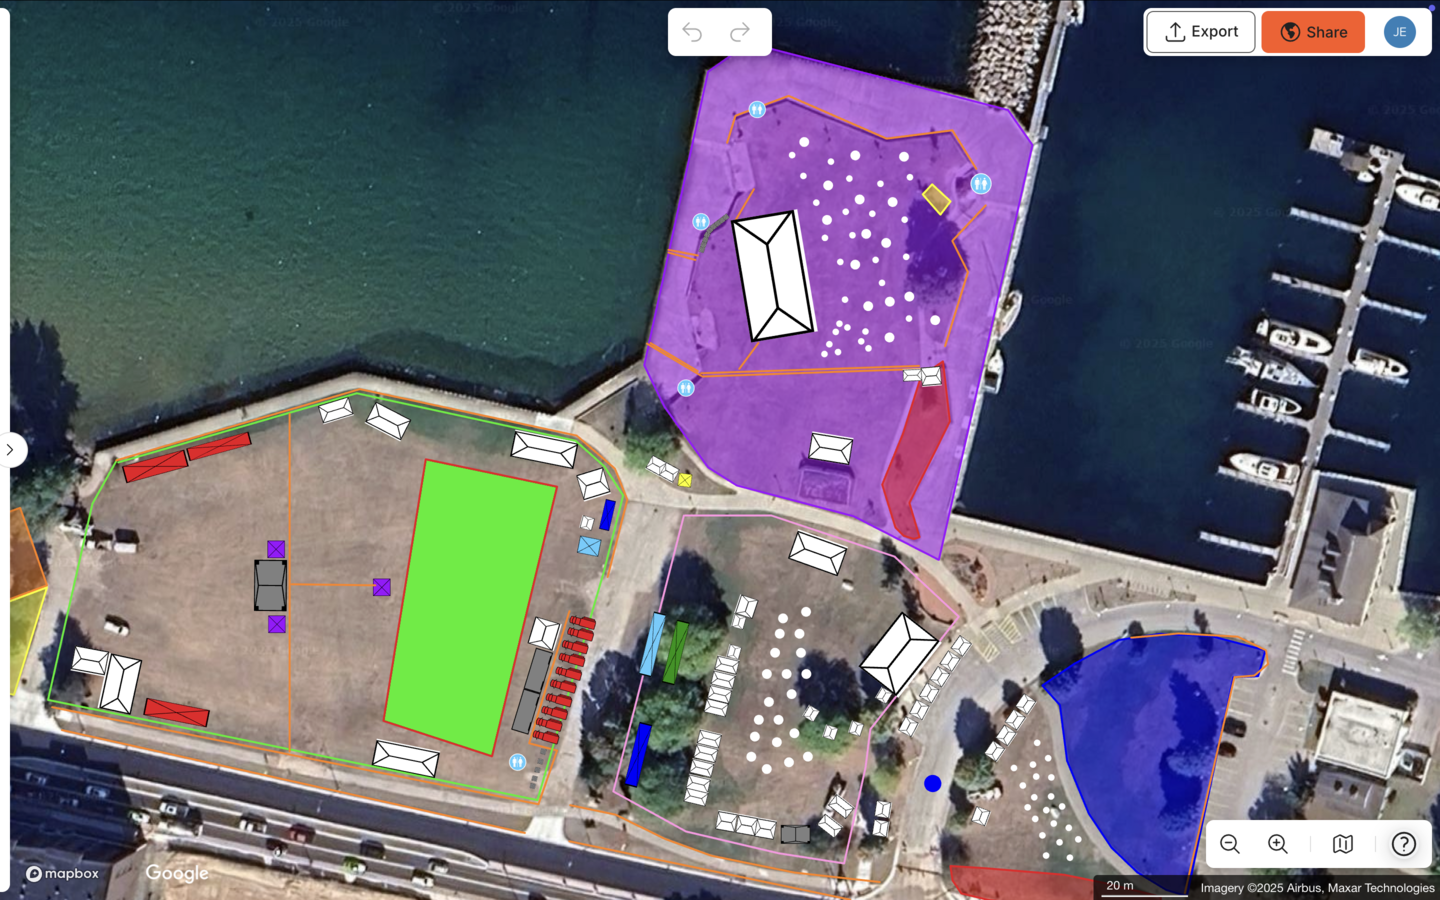
Subtracting Non-Usable Space Before You Calculate
Raw venue square footage never matches usable crowd space. Every event site contains areas that cannot hold standing attendees, and failing to subtract them is one of the most common errors in manual capacity planning.
Work through these subtractions in order, then apply the formula to the remaining area.
Step 1 — Stages and performance structures. Measure the full footprint of every stage, including any thrust extensions, speaker wings, and delay towers, because these structures occupy ground that cannot hold attendees. For example, a 40 × 30 ft main stage removes 1,200 sq ft from your usable crowd area immediately.
Step 2 — Bars, food stalls, and vendor units. Each bar or food and beverage stall has a footprint plus a service queue zone that displaces people. A standard 10 × 10 ft vendor unit occupies 100 sq ft, before you even account for queuing space.
Step 3 — Aisles and emergency access routes. Fire marshals and local authorities typically require clear egress corridors that remain free of standing attendees. These vary by jurisdiction, but a minimum 10 ft clear aisle is a common planning benchmark. Map every required route, calculate its area, and subtract it from the gross figure.
Step 4 — Restrooms, welfare, and first aid. Portable toilet banks, first aid tents, and welfare areas all consume ground that cannot hold general attendees, so their footprints must come out of your crowd area.
Step 5 — Structural columns, barriers, and fixed infrastructure. Indoor venues have columns, while outdoor sites have crowd barrier pens, production compounds, and generator areas. Subtract each of these fixed elements so your remaining area reflects only true standing space.
After all subtractions, the remaining figure becomes your usable crowd area. At that point you can divide by your square feet per person benchmark with confidence. See how OnePlan calculates exact square footage as you draw, so every subtraction is precise.
Applying a 10–25% Safety Buffer to Your Numbers
A raw capacity figure still carries risk even when you subtract non-usable space correctly. Crowds do not distribute evenly, and people cluster near stages, avoid edges, and bunch at entry points. A safety buffer accounts for this real-world behavior and gives you a defensible margin when you present numbers to permitting authorities.
The standard planning range uses a 10–25% reduction from your calculated maximum.
Safe Capacity = Calculated Maximum × (1 − Buffer %)
A 10% buffer suits well-controlled, lower-density events such as community fairs or outdoor markets, where crowd behavior stays predictable and distribution tends to remain more even. A 25% buffer works better for high-density festival floors, events with complex crowd flow, or any event where the permitting authority expects conservative figures, because uneven distribution and clustering create greater risk and the larger buffer provides essential headroom. For events with multiple crowd zones feeding into shared egress points, some planners apply zone-specific buffers rather than a single site-wide figure.
Bearfoot Productions, which has scaled festivals to 10,000-capacity events, uses OnePlan’s crowd capacity tools for visual confirmation of capacity figures: “It’s nice to have a visual shape on our plan that shows me I can get 7,000 people at one person per square metre in there.”
Safety and crowd flow remain top concerns across the industry. The Beirut Marathon’s Race Director highlighted OnePlan’s crowd measurement feature as one of the most valuable tools for understanding how many people fit safely in a given area, which provides exactly the kind of defensible, documented figure that supports permit applications and safety reviews. OnePlan’s 2026 Event Site Planning Report found that 71% of event professionals rank attendee safety and security as their top planning priority, and over one in three named crowd safety and flow as their single biggest challenge. A buffer becomes a practical requirement, not an optional extra, because it often marks the difference between a plan that passes review and one that does not. Join a 15-minute OnePlan session to see how the crowd capacity calculator helps you set and document your buffer before submission.
Worked Capacity Examples for 1,000, 2,000, and 3,000 Sq Ft
If you’d rather skip the manual math, OnePlan’s arrival and exit calculators (available free at calculators.oneplan.io/arrival and calculators.oneplan.io/exit/calculator) can already run these specific calculations for you, estimating queue length, queue time, and exit flow for your site. The worked examples below show the underlying logic so you understand what the calculators are doing on your behalf.
Example 1: 1,000 Sq Ft Space
Start with a gross area of 1,000 sq ft. Subtract a small stage of 200 sq ft, one bar unit with queue zone of 160 sq ft, and a first aid point of 40 sq ft. The usable area becomes 600 sq ft. At a general standing density of 8 sq ft per person, 600 ÷ 8 = 75 people. Apply a 15% safety buffer and 75 × 0.85 = 64 people safe capacity.
Example 2: 2,000 Sq Ft Space
Start with a gross area of 2,000 sq ft. Subtract a stage of 300 sq ft, two vendor units with queues totaling 320 sq ft, an aisle corridor of 150 sq ft, and a restroom access zone of 80 sq ft. The usable area becomes 1,150 sq ft. At 8 sq ft per person, 1,150 ÷ 8 = 144 people. Apply a 20% buffer and 144 × 0.80 = 115 people safe capacity.
Example 3: 3,000 Sq Ft Space
Start with a gross area of 3,000 sq ft. Subtract a main stage of 400 sq ft, three vendor units with queues totaling 480 sq ft, two aisle corridors totaling 300 sq ft, a portable restroom bank of 200 sq ft, and a first aid tent of 100 sq ft. The usable area becomes 1,520 sq ft. At 8 sq ft per person, 1,520 ÷ 8 = 190 people. Apply a 25% buffer for a dense festival floor and 190 × 0.75 = 143 people safe capacity.
These examples show how strongly non-usable space and buffers reduce a headline square footage figure. A 3,000 sq ft space does not hold 375 people at 8 sq ft per person, because it holds closer to 143 once the site is properly accounted for. Try these same scenarios on a OnePlan live map, where every subtraction appears visually and every number ties to a to-scale object.
When Spreadsheets Fall Short and Software Takes Over
Spreadsheets can handle the arithmetic in the formula above, but they cannot show whether the arithmetic reflects reality. A cell that says “subtract 300 sq ft for the stage” has no way of confirming that the stage actually fits in that corner, that the aisle beside it meets the required width, or that the remaining crowd area connects logically to the exits.
Manual methods also create version-control problems as soon as more than one person becomes involved. Operations, security, and the permitting authority often work from different snapshots of the plan, and discrepancies only surface on event day when changes become costly.
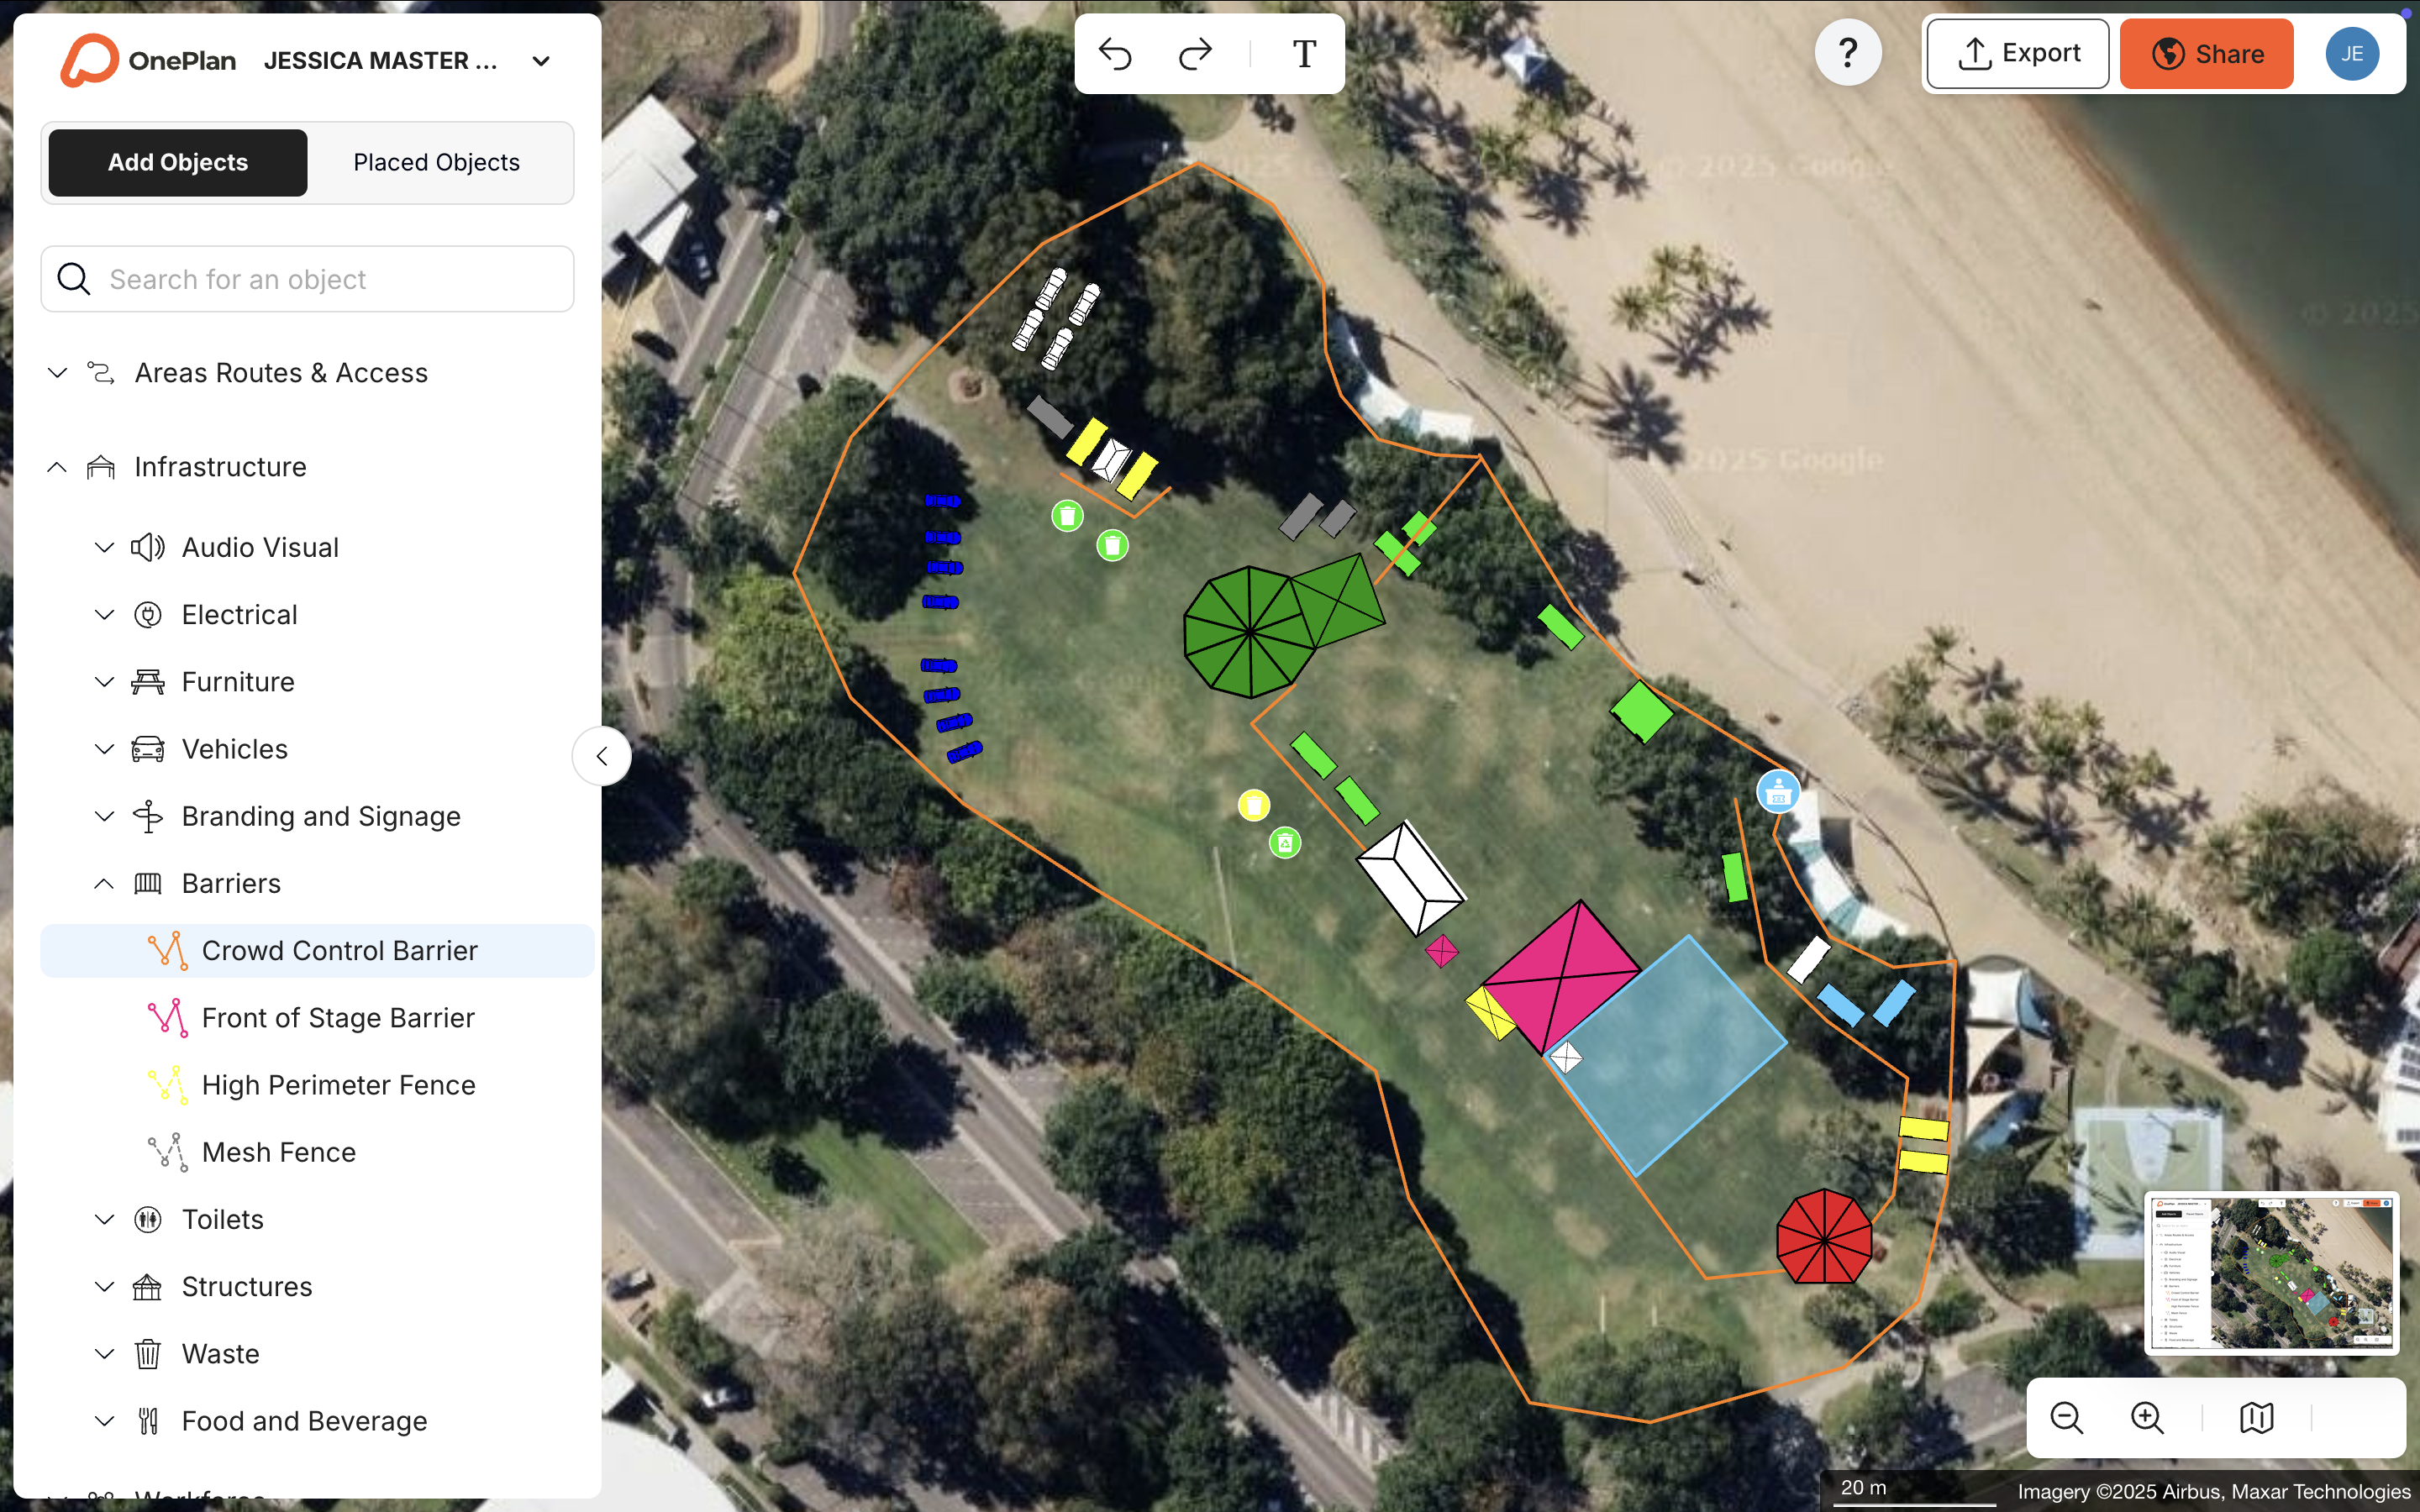
OnePlan replaces the spreadsheet with a to-scale, map-based crowd capacity calculator. Draw a crowd area on the live satellite map, select your density, and the capacity figure updates instantly, tied to a shape that reflects the actual ground. Subtract the stage by placing a to-scale stage object and the crowd area recalculates around it. Every number stays anchored to geometry, not to a cell reference.
Capacity is only one piece of crowd safety, because you also need to understand how people move through the site. OnePlan’s arrival and exit calculators (available free at calculators.oneplan.io/arrival and calculators.oneplan.io/exit/calculator) estimate queue length, queue time, and exit flow so you can model the full ingress and egress picture before gates open. The auto-generated Bill of Quantities then turns every object on the map into an exportable inventory, including crowd barriers, fencing meters, and portable restrooms, so procurement follows directly from the plan without re-keying.
The 2026 Event Site Planning Report found that 44% of event professionals say accurate measurements and layouts are critical to success, yet inaccurate plans still cause overcrowded spaces, unnecessary costs, and late rework. Moving from a spreadsheet to professional software means moving from a number you hope is right to a number you can prove is right. See how quickly your existing site plans can become live, to-scale crowd capacity models in a short OnePlan walkthrough.
Conclusion: Turning Capacity Math into a Defensible Plan
Accurate standing crowd capacity comes down to four steps: apply the correct square feet per person benchmark for your layout type, subtract every non-usable area from your gross square footage, apply a 10–25% safety buffer, and document the result against a to-scale plan. Skipping any step produces a number that looks precise but will not stand up under scrutiny.
OnePlan’s crowd capacity calculator handles all four steps on a live map, turning a single capacity figure into a full, shareable, to-scale site plan with an automatic Bill of Quantities. Plan your next event the straightforward way, and either open a free OnePlan account or schedule a 15-minute walkthrough to see the platform in action.
Common Questions About Event Capacity Calculators
What is the standard square feet per person for a standing event?
For most permitted standing events, planners work in the 6–10 square feet per person range, which covers general festival floors, outdoor receptions, and road race finish areas. Looser networking-style events use 10–15 square feet per person, while dense concert floors may plan as low as 4–6 square feet per person. The right figure depends on your event type, expected crowd behavior, and what your local permitting authority accepts. Always confirm with the relevant fire marshal or licensing body for your specific location, because requirements vary by state and country.
How do I calculate the usable area of my event space?
Start with the gross square footage of your venue or site. Then subtract the footprint of every structure and zone that cannot hold standing attendees, including stages and production areas, bar and food vendor units plus their queue zones, required aisle and egress corridors, restroom and welfare areas, first aid tents, and any fixed infrastructure such as columns or generator compounds. The remaining figure becomes your usable crowd area. In practice, non-usable space can remove a substantial portion of a site’s gross area, which is why starting from gross square footage without subtraction creates significant overcrowding risk.
Why do I need a safety buffer on top of my capacity calculation?
Crowds do not distribute evenly across a space. Attendees cluster near stages and bars, avoid peripheral areas, and bunch at entry and exit points. A 10–25% safety buffer accounts for this real-world behavior and keeps your planned capacity within safe limits even when distribution becomes uneven. The buffer also gives you a margin when presenting figures to permitting authorities, who may apply their own reduction factors. A 10% buffer suits lower-density, well-controlled events, while a 25% buffer works better for high-density festival floors or events with complex crowd flow patterns.
Can I use OnePlan’s crowd capacity calculator for seated events?
OnePlan’s crowd capacity calculator is designed for standing crowd calculations only. It lets you draw any crowd area on a live, to-scale map, select a standing density, and instantly see the safe standing capacity for that space.
What’s the difference between using a spreadsheet and OnePlan for capacity planning?
A spreadsheet can perform the arithmetic of the capacity formula, but it has no spatial awareness. It cannot confirm that your stage footprint is correctly sized, that your aisle width meets the required clearance, or that the crowd area you calculate actually connects logically to your exits. OnePlan ties every number to a to-scale object on a live satellite map, so subtractions stay visible and verifiable rather than assumed. The platform also generates a Bill of Quantities automatically from everything placed on the map, and its free arrival and exit calculators extend the capacity picture to ingress queue times and exit flow rates, which a spreadsheet would require entirely separate models to produce.