
Written by: Paul Foster, Founder, CEO, OnePlan | Last updated: September 14, 2026
Key Takeaways
- Christmas market crowd flow means how visitors move through a temporary holiday market site. Layout choices decide whether that movement stays safe and comfortable.
- Core rules include wide main walkways of roughly 10–12 ft, narrower secondary aisles, food vendors placed away from entries with dedicated queue space, a clear ring around central attractions, and gated or otherwise controlled access points.
- Effective planning uses a to-scale map, a loop circulation model where possible, separate moving and stopping zones, and early identification of pinch points such as entries, popular stalls, and narrow streets.
- Peak capacity comes from arrival rate and dwell time. Planners should model queues, size entries for peak flow, and use calculators so they can present defensible numbers in safety meetings.
- OnePlan lets you build accurate, to-scale Christmas market plans, model crowd flow, and generate the numbers you need for approvals. See how OnePlan works for your market.
Who This Guide Is For
This guide supports Christmas market organizers, operations managers, festival and market producers, and local-government events officers who are mid-planning. Many readers will be weeks or months out and need defensible answers for a fire marshal, police licensing contact, or (in the UK) a Safety Advisory Group meeting.
The focus is temporary Christmas market sites such as town squares, parks, pedestrianized streets, and narrow historic streets. These sites often include stalls, food and drink vendors, a central attraction, live music, and Santa or photo areas. Before you move into the steps, keep these core concepts in mind, because the guide uses them throughout.
- Site layout: the physical arrangement of stalls, infrastructure, and open space on the ground.
- Crowd flow: how visitors move through that layout over time.
- Ingress and egress: how people enter and leave the site.
- Dwell time: how long a visitor stays at a stall or at the site overall.
- Arrival rate: how many people arrive per hour.
- Queue formation: what happens when arrival rate at a stall or gate exceeds its service rate.
- Pinch points: locations where effective width narrows and crowd density spikes.
- Peak-load windows: the hours when the site is at or near its maximum occupancy.
Christmas Market Crowd Flow Rules
The figures below draw from recognized crowd-management frameworks, including John Fruin's pedestrian level-of-service research and G. Keith Still's crowd science framework. They give you a defensible starting point for your safety meeting. Requirements vary by region, so confirm with your local authorities, fire marshal, and police licensing before finalizing any plan.
- Main walkways: wide enough for two-way flow and emergency access. Fruin's research shows that corridors and walkways have a maximum pedestrian traffic capacity of approximately 25 persons per minute per foot of clear width at high crowd density. This means a 6 ft walkway maxes out at roughly 150 persons per minute in dense conditions. Many organizers therefore work to a main corridor of roughly 10–12 ft, which gives two-way flow room to breathe and preserves emergency access. Confirm the exact figure locally.
- Secondary aisles: narrower than main walkways, but still functional for two-way movement. In busy walkways and main aisles, event planners should keep 5–6 ft of clear walking space. Secondary aisles can be narrower than main routes, yet where you expect two-way movement they still need enough width for opposing flows to pass without conflict.
- Food and drink vendors: away from entries, with dedicated queue space. Popular stalls generate the longest queues, so placing them near an entry means that queue blocks the main approach. Give each stall its own queue area so the line has somewhere to form without spilling into the walkway.
- Central attraction ring: keep a clear ring around it. A Christmas tree, stage, or carousel draws people to stop. A clear ring around it keeps a moving lane open on all sides. Many organizers use roughly 12 ft, subject to local requirements.
- Gated or controlled access points. Entry and exit points should be designed for peak flow rate rather than average attendance, because the average hides the moments where the balance between arrival and service rate collapses.
Step 1 — Map the Christmas Market Site to Scale
Every later decision in this guide depends on an accurate, to-scale base plan. Without that base, corridor widths become guesses, stall footprints stay approximate, and queue space turns into wishful thinking.
Plans made in PowerPoint, Excel, Canva, Photoshop, Google Maps, or internal static, top-view screenshots and plan files are not to scale. A tent that looks right on a slide may be three times too large for the actual space. Layouts built this way rely on guesswork, which often fails at the safety meeting and on event day.
OnePlan's base layer uses a live, zoomable satellite or street map. Every object placed on it, including tents, stalls, crowd barriers, fencing, generators, food trucks, and signage, stays accurately to scale as you zoom. The area and perimeter calculator outlines any space and instantly returns its size in square feet, so you know exactly how much room you have before placing a single stall. You can import existing PDFs, images, drone shots, and CAD-derived files as long as you convert them to .png first, then scale them onto the map and build on top.
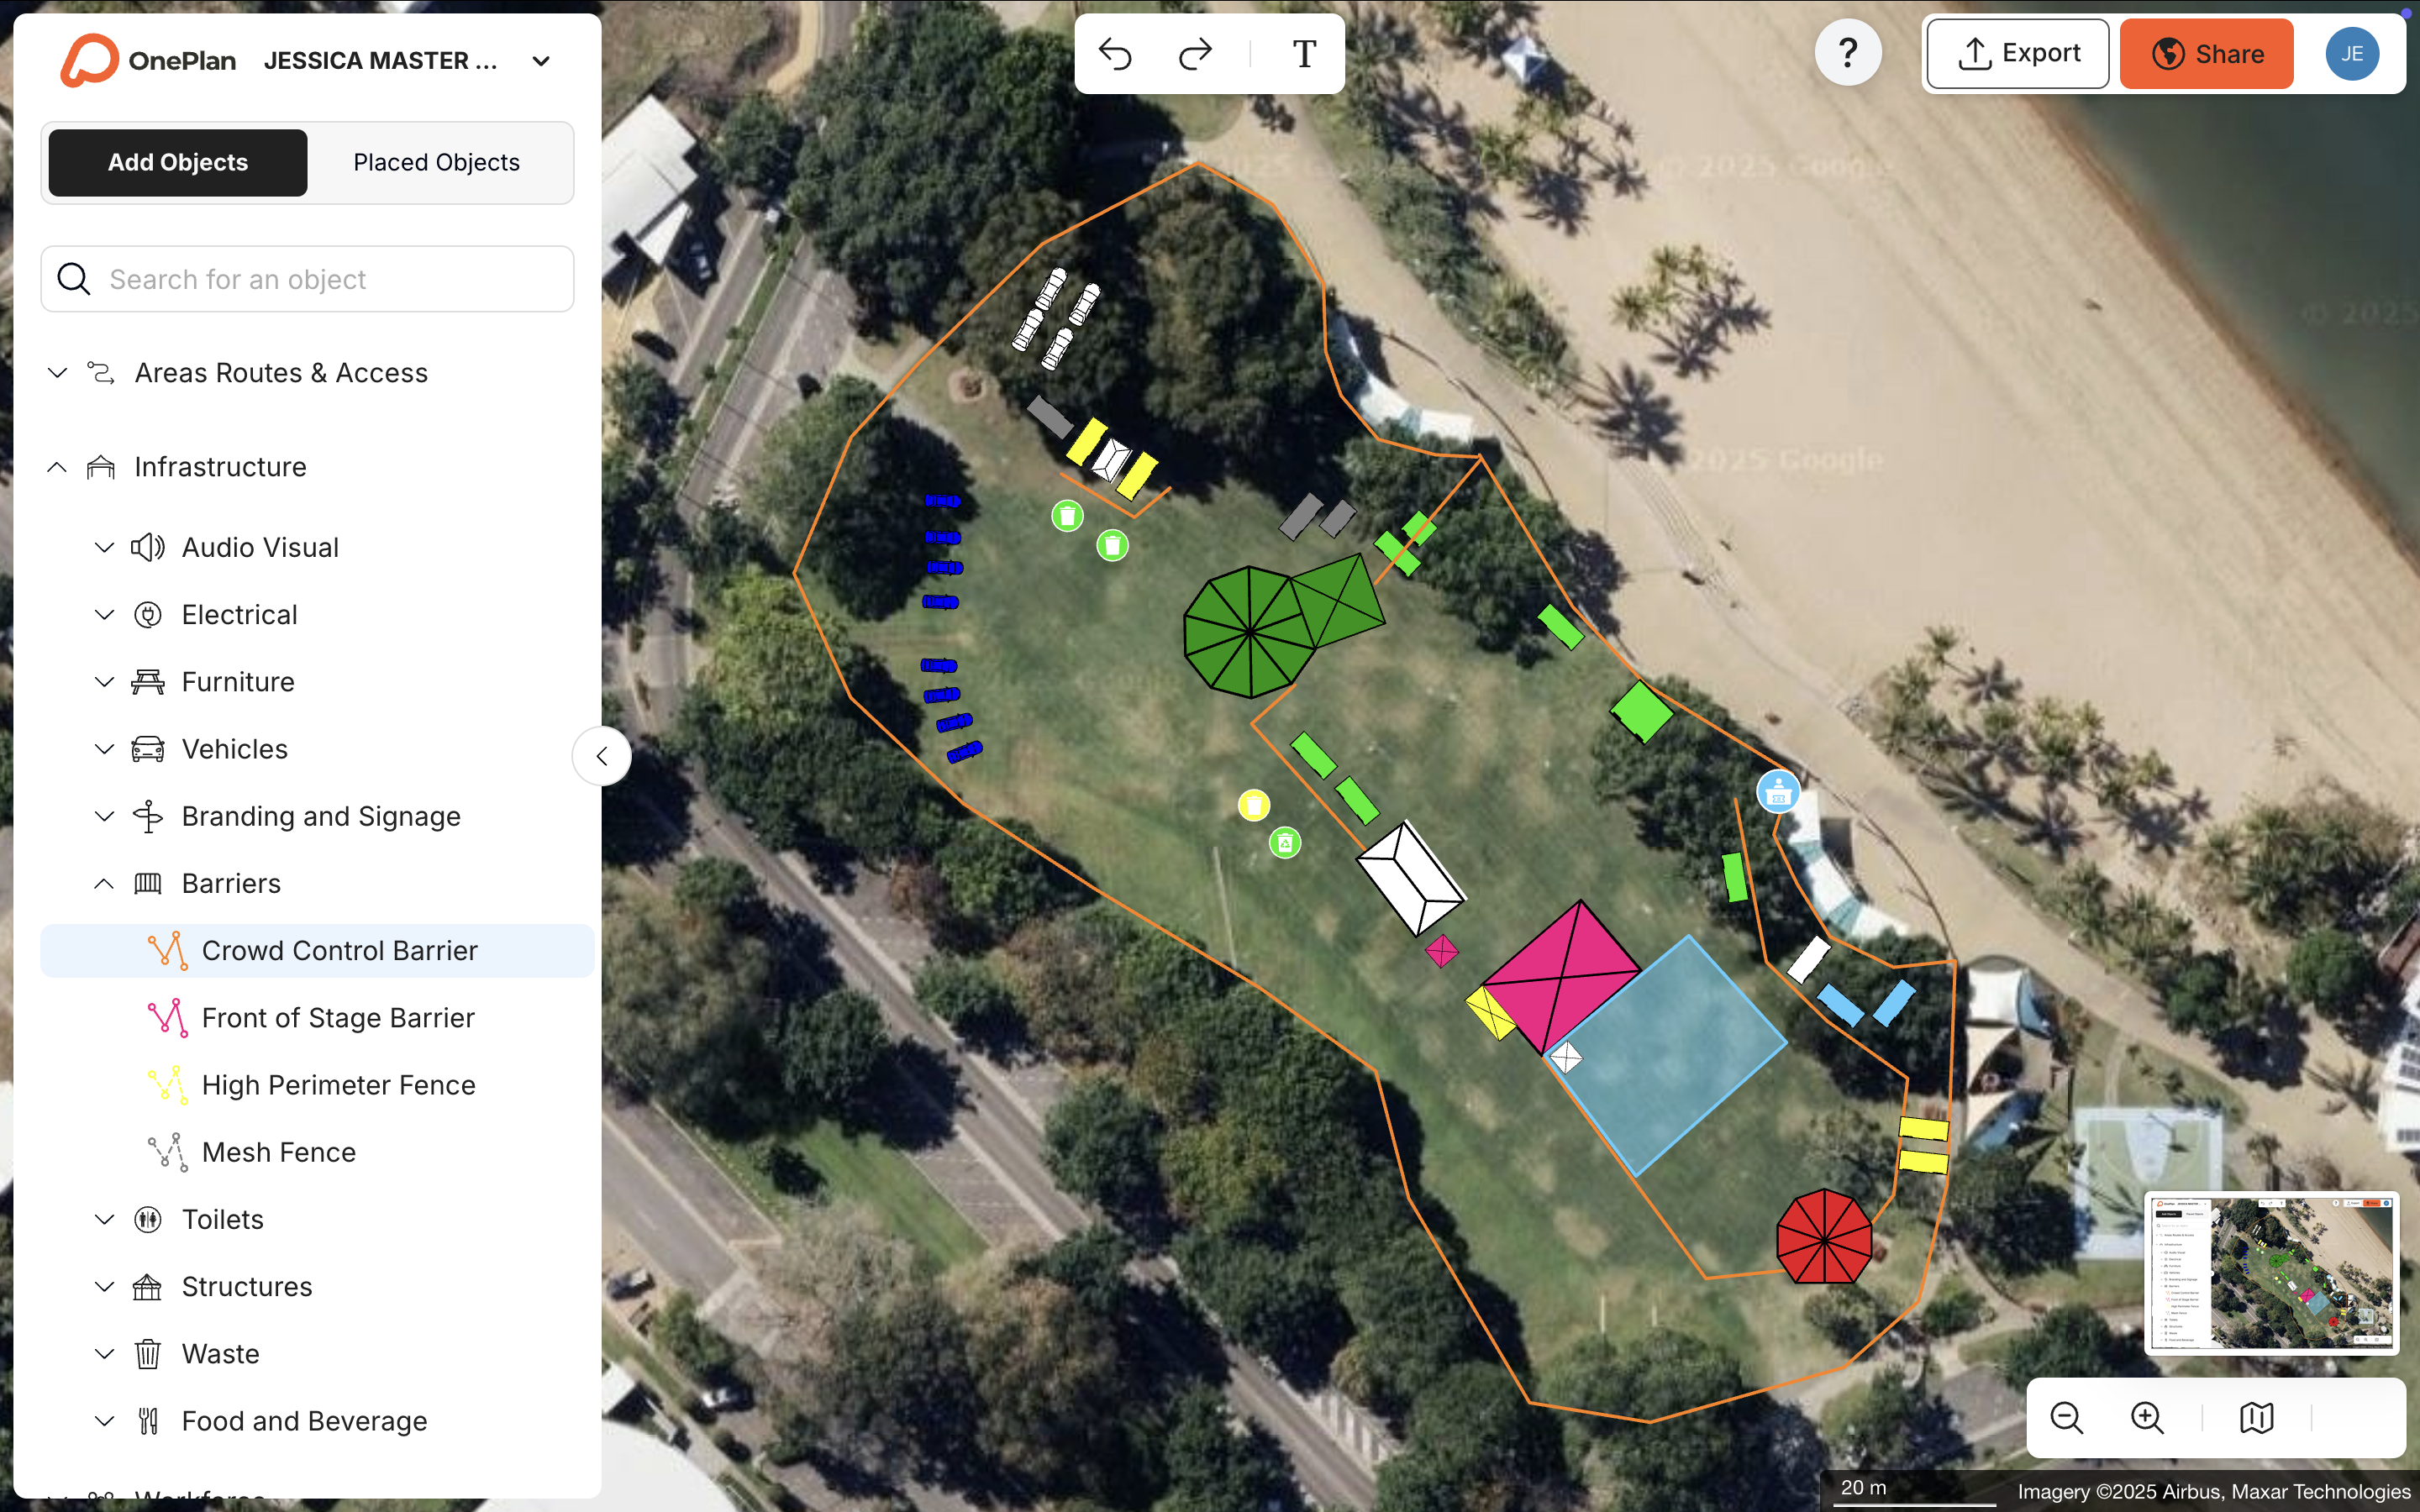
OnePlan has powered 200,000 events in 150 countries, from community Christmas markets to the Paris 2024 Olympic Games. Eagle Mountain City cut planning from 8–10 hours to a few hours per event and reported a 5x return on investment after switching from disconnected tools to a single, to-scale map. With an accurate base map in place, the next decision is how visitors will move through it.
Step 2 — Choose a Circulation Model: Loop vs. Dead End
Decide how visitors will move through the site before you place a single stall. Two basic models apply to most Christmas markets.
- Loop layout: visitors circulate around a central attraction. People spread out naturally, density distributes across the whole route, and no single congested spine dominates. This layout suits most Christmas markets.
- Dead-end layout: a single aisle or row of stalls with no through-route. Everyone who walks in must walk back out the same way. This pattern creates a predictable bottleneck at the turning point and at the entry and exit.
Use a loop wherever the site allows it. Simulation-based studies indicate reductions of 30–40% in peak crowd density and 20–35% in bottleneck duration under optimized crowd-management conditions, with one-way circulation consistently associated with better crowd-safety outcomes.
Where the site geometry forces a dead end, such as a narrow historic street, plan one-way circulation clearly marked with signage and staffed at both ends so arriving and leaving crowds do not collide head-on. Maintain a clear 12 ft ring around any central attraction so people can pass on all sides without being forced into a pinch point.
Step 3 — Set Corridor Widths and Separate Moving from Stopping Zones
The most common Christmas market layout mistake is placing a stopping zone inside a moving lane. A queue that forms in a walkway eats into its usable width. At peak times, that loss of width can bring the whole site to a standstill.
The rules are straightforward.
- Main walkways need to be wide enough for two-way foot traffic and emergency access. Many organizers work to roughly 10–12 ft, but you should confirm the figure with your local authorities.
- Secondary aisles can be narrower than main walkways, yet they still need enough width so that two-way movement can pass without conflict.
- Every food and drink stall, photo spot, and performance area needs dedicated queue space sized and positioned so that a full queue does not extend into the moving lane.
Effective width, not nominal width, governs crowd flow. Merchandising stands, parked vehicles, and temporary structures quietly reduce effective width, turning a designed-safe route into a choke point. In OnePlan, every object placed on the map is to scale, so you can see immediately whether a stall or barrier is eating into your corridor width before anything is installed on site.
For more on Christmas market layout principles, see OnePlan's dedicated Christmas market layout guide and public market crowd flow article. Even with correct widths, some locations will still narrow under pressure. Those are your pinch points.
Step 4 — Identify and Fix Pinch Points
A pinch point is any location where effective width narrows and crowd density spikes. At a Christmas market, the predictable pinch points are:
- Entries and exits — the highest-risk locations, where arriving and leaving crowds converge.
- Popular food and drink stalls — at the 2024 Manchester Christmas Markets, popular food and drink stalls such as The Flat Baker, C&C, and Waffle Kart generated the longest queues, with The Flat Baker's queue extending outside the market.
- Santa and photo areas — families stop, queue, and occupy space for longer than average dwell time.
- Live music stages — crowds gather and stop moving, blocking the surrounding circulation route.
- Ride queues — carousel and fairground ride queues extend unpredictably and spill into walkways.
- Narrow historic streets — fixed geometry that cannot be widened, so flow management becomes the only fix.
Real-world examples confirm these patterns. A qualitative hazard-identification study of Nanggalo Market in Padang, Indonesia, found that narrow circulation paths between vendor stalls were identified as a hazard by 60% of respondents, and traffic congestion at the market entrance on weekends and holidays was reported by 51.1% of respondents. No control measures were in place for either issue. The absence of a vendor zoning system interacted with narrow paths to create a disorganized environment where pedestrian flow was impeded throughout.
For each pinch point, apply the same logic. Widen the approach, move the stall away from the entry, add a dedicated queue lane, use one-way circulation, or reposition staff and barriers. In OnePlan, you can test each fix on the map before committing to it on site. Moving a stall, widening a corridor, or adding a barrier takes seconds.
Step 5 — Plan Gated Access and One-Way Circulation
Christmas markets are often gated to monitor capacity and to keep pedestrian paths safe from nearby vehicle traffic. Both goals are legitimate and both create the same operational challenge. The entry point becomes the site's primary pinch point.
Congestion begins at the moment arrival rate exceeds the gate's service rate, causing a queue to form and density to build up behind people before anyone at the front notices. The fix is to design the entry so that the gate's service rate can match peak arrival rate.
Use these practical steps for gated access design.
- Separate entry and exit gates so arriving and leaving crowds do not collide.
- Size the entry for peak flow, not average attendance. The average hides the moments where the balance between arrival and service rate collapses.
- On narrow historic streets, use one-way circulation with clearly marked entry and exit points at opposite ends of the street.
- Staff the entry with enough personnel to process arrivals at the expected peak rate, and have a plan for holding arrivals upstream if the site reaches capacity.
- Use crowd barriers to create a structured queue approach to the gate, which prevents uncontrolled crowd build-up.
Step 6 — Manage Peak Load with Arrival Rate, Dwell Time, and Queue Estimates
Peak capacity at a Christmas market is the result of two variables interacting over time: arrival rate, meaning how many people arrive per hour, and dwell time, meaning how long they stay. When arrivals outpace departures, occupancy climbs. When it reaches the site's safe capacity, the site is at peak load.
The most dangerous moment in a crowd relates to what researchers call 'pressure', defined as density multiplied by the variance in people's speeds. When a fast-moving flow meets a wall or stopping point, it generates pressure beyond what the raw density figure suggests. This is why peak-load management is not just about headcount. It also concerns where people are and how fast they are moving when the site is fullest.
At the stall level, queue length comes from the balance between arrival rate and service rate. If arrivals keep beating service, the line grows. If service beats arrivals, the line shrinks. When a glühwein stall serves customers slowly but arrivals keep coming, the queue extends into the walkway within minutes of peak hour starting.
Use OnePlan's free calculators to model these numbers before event day.
- Arrival calculator — estimate queue length and queue time for ticket checks and security screening operations at your entry points.
- Exit calculator — estimate exit capacity using exit width, crowd size, and flow rate.
- Crowd capacity calculator — outline any area in OnePlan and instantly see its standing capacity based on a selectable people-per-square-meter density. OnePlan's crowd capacity calculator covers standing capacity only, not seated.
These tools give you numbers you can present to a fire marshal or licensing contact and defend. They replace the guesswork that comes from planning in static files.
Step 7 — Staff, Barrier, and Observe
A plan that works on a map also needs to work on the ground. The final step translates the layout into a staffing and barrier plan, then uses real behavior on event day to refine that plan.
Steward placement follows the pinch-point checklist from Step 4, including entries and exits, popular food and drink stalls, Santa and photo areas, live music stages, ride queues, and narrow historic streets. Research supports this approach: events where trained marshals were deployed had significantly fewer incidents of sudden scuffles, and stationing trained attendants at high-risk bottlenecks such as narrow passageways helped balance crowd movement.
OnePlan's workforce and dot planning lets teams place staff as dots on the map, assign names, shift times, notes, and equipment, and draw the routes they need to cover. Every steward position is visible on the same plan as the stall layout, barrier lines, and entry points. The whole team works from one source of truth instead of a separate staffing spreadsheet.
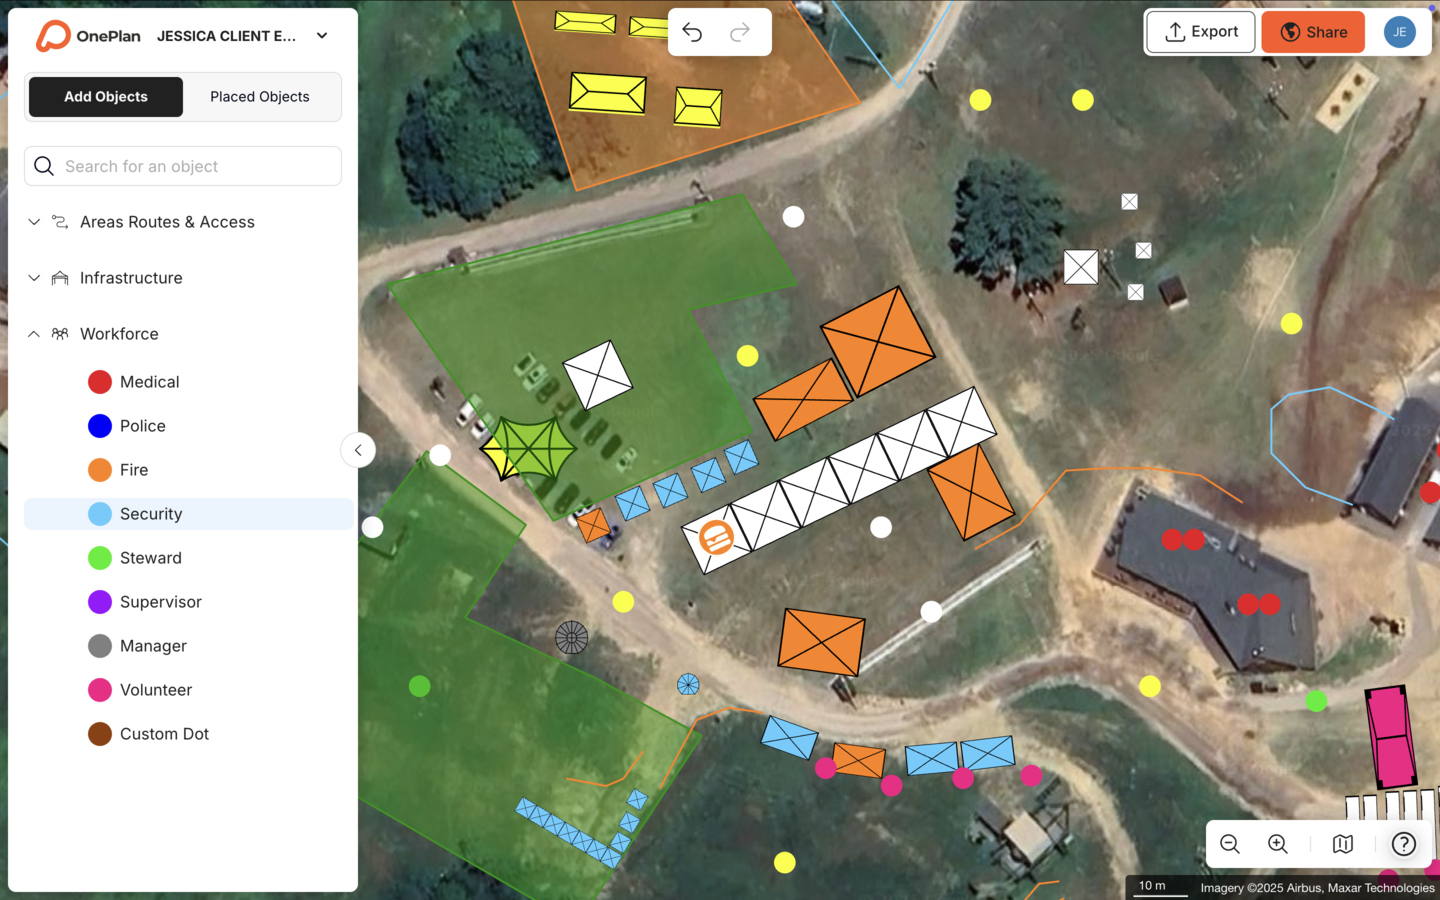
On event day, observe where queues actually form and how long they get. Compare observed behavior against the estimates from OnePlan's arrival and exit calculators. Use that comparison to refine the plan for the next day of the market or for next year's event.
Tools, Frameworks, and Evaluation Criteria
The table below compares the three main approaches to Christmas market site planning. The key takeaway is that only OnePlan combines to-scale mapping, real-time collaboration, and event-specific objects, which are the capabilities that determine whether your plan stands up in a safety review.
| Approach | To Scale On A Live Map | Real-Time Collaboration | Event-Specific Objects And Bill Of Quantities |
|---|---|---|---|
| Manual tools (PowerPoint, Excel, Canva, Photoshop, Google Maps, static screenshots) | No | No | No |
| Complex engineering software (CAD, AutoCAD, Bluebeam, Revit) | Yes | Limited | No |
| OnePlan | Yes | Yes | Yes |
OnePlan is the only option in this list that is accurate, easy, and affordable at the same time. You get a to-scale, map-based plan, drag-and-drop simplicity you can use in seconds, real-time collaboration on a single source of truth, an auto-generated Bill of Quantities, and a free first event. OnePlan's 2026 Event Site Planning Report found that over 1 in 3 event professionals name crowd safety and flow as their single biggest challenge, and 71% say attendee safety and security is their top priority when planning a site.
Apply these key planning frameworks alongside OnePlan.
- Entry-to-exit visitor journey: follow a visitor from arrival to exit and identify every point where they stop, queue, or change direction.
- Loop vs. dead-end decision: make this decision at Step 2 before any stalls are placed.
- Moving vs. stopping zones: treat every area on the site as one or the other, never both.
- Pinch-point checklist: use the entries, exits, and other locations identified in Step 4 as your standard review list.
For Christmas market layout examples and capacity planning detail, see OnePlan's Christmas market layout guide and Christmas market capacity planning article.
Common Challenges and Troubleshooting
Christmas market crowd flow problems tend to follow a few patterns. Here are the most frequent issues and what causes them.
- Inaccurate, non-to-scale layouts. Plans built in non-to-scale tools place stalls and corridors at the wrong size. The error only becomes visible on site, when it is too late to fix without cost and delay. Fix: build on a live, to-scale map from the start.
- Version control chaos. Plans emailed back and forth between departments produce multiple conflicting versions. The operations team works from one file and the fire marshal from another. Fix: use one live plan in OnePlan, shared with all stakeholders in real time.
- Siloed department plans. Security, traffic, and operations each maintain their own map, so nobody has the full picture. Fix: create a single source of truth where every department works in the same plan.
- Underestimated infrastructure needs. Barriers, fencing, and toilets are ordered from a rough estimate rather than a measured plan. Fix: OnePlan's auto-generated Bill of Quantities turns every object on the map into an exportable inventory. Draw a line of crowd barriers and OnePlan tells you exactly how many segments to order.
- Bottlenecks at predictable pinch points. These bottlenecks appear at the locations identified in Step 4. Fix: identify them on the map before event day, apply the fixes in Step 4, and model queue lengths using OnePlan's arrival calculator.
- Queues that strangle the whole site. A single popular stall with no dedicated queue space can block the main walkway and back up the entire site. Fix: place food and drink vendors away from entries, with dedicated queue lanes sized to hold a full queue without extending into the moving lane.
Measuring Success
A Christmas market crowd flow plan worked if the site moved safely, queues stayed manageable, and the safety meeting went smoothly. You can measure success more specifically with a few clear checks.
- Planning accuracy: check whether the stalls, corridors, and infrastructure fit the space as planned. Fewer on-site surprises mean the to-scale plan did its job.
- Fewer revisions: track how many times the plan changed after the first draft. A to-scale plan in OnePlan reduces late-stage rework because problems are visible before anything is installed.
- Smoother approvals: note whether the fire marshal or licensing contact approved the plan without major objections. Accurate, to-scale layouts and crowd-capacity figures from OnePlan's calculators make approvals faster and better documented.
- Queue and exit performance vs. estimates: compare the queue lengths and exit capacity estimated by OnePlan's calculators against observed event-day behavior. A close match means the model is reliable for next year.
- Year-on-year improvement: reuse the OnePlan plan as a template for next year's market. Each year, the plan gets more accurate as observed behavior feeds back into the model.
Customer results show what is possible. SoulFest cut planning time by 85%, building almost its entire festival map within two days. The Tour of Britain reduced site visits by 75% and saved 300+ hours a year. Eagle Mountain City cut planning from 8–10 hours to a few hours per event and reported a 5x return on investment.
Advanced Considerations and Next Steps
Teams that run the same Christmas market year after year, or manage multiple market sites, can take planning further with a few advanced practices.
- Standardizing layouts across sites or years. Save the OnePlan map as a reusable template. Next year's market starts from a tested, accurate base rather than a blank canvas.
- Cross-department collaboration models. Bring operations, security, traffic, and the fire marshal into the same OnePlan plan. Every department sees the same up-to-date layout instead of maintaining separate files.
- Scenario planning for weather and crowd conditions. A wet Saturday afternoon drives visitors indoors and concentrates them at covered stalls. A dry weekend evening extends dwell time and raises peak occupancy. Model both scenarios in OnePlan before the market opens.
- Post-event optimization. After each market, compare estimated queue lengths and exit capacity from OnePlan's calculators against observed behavior. Update the plan, note what changed, and carry the improved model into next year.
- Multi-site consistency. If your organization runs Christmas markets in multiple town centers, OnePlan lets you apply consistent layout standards, corridor widths, and pinch-point fixes across all sites from one account.
You are ready to move beyond the basics when your plan is accurate enough to defend at a safety meeting without revision, your queue estimates match observed behavior within a reasonable margin, and your team is reusing the same template year on year rather than rebuilding from scratch.
Frequently Asked Questions
How Wide Should Christmas Market Walkways Be?
Main walkways at a Christmas market should be wide enough for two-way foot traffic while maintaining emergency access. Many organizers work to roughly 10–12 ft, though the figure should be confirmed with your local authorities. Secondary aisles, the narrower routes between stall rows, are typically narrower than main routes but still sized so that two-way movement can pass without conflict. These figures reflect the pedestrian level-of-service research established by John Fruin, which found that walking becomes significantly restricted at around 10 square feet per person, and that a stopped group or stationary obstacle reduces a corridor's effective usable width, because pedestrians maintain a clearance from walls and stationary obstacles so that the space within corridors is never fully utilized; the exact reduction depends on the buffer distances involved rather than being a fixed halving. In practice, this means a 10 ft walkway with a queue spilling out of a stall on one side can lose several feet of usable moving space, which is not enough for comfortable two-way flow at peak times. Always confirm specific requirements with your local authorities, fire marshal, and police licensing, as requirements vary by region.
Where Should Food Stalls Go at a Christmas Market?
Food and drink stalls, particularly high-demand vendors like glühwein and bratwurst stands, should sit away from entries and away from the main walkway intersections. Each stall needs dedicated queue space sized to hold a full queue without extending into the moving lane. The reason is straightforward. At the 2024 Manchester Christmas Markets, popular food and drink stalls such as The Flat Baker, C&C, and Waffle Kart generated the longest queues, with The Flat Baker's queue extending outside the market. A glühwein stand placed near the entry will create a queue that blocks the entry approach within minutes of peak hour starting. Placing it deeper into the site, with a dedicated queue lane running parallel to, not across, the main walkway keeps the entry clear and the queue contained.
How Do You Stop Bottlenecks at a Christmas Market Entrance?
The entry is the highest-risk pinch point at any Christmas market. The most effective fixes are to separate entry and exit gates so arriving and leaving crowds do not collide, design the entry for peak flow rate rather than average attendance, use crowd barriers to create a structured queue approach to the gate, staff the entry with enough personnel to process arrivals at the expected peak rate, and hold arrivals upstream if the site reaches capacity. On narrow historic streets, one-way circulation with clearly marked entry and exit points at opposite ends of the street is the most reliable solution. Use OnePlan's free arrival calculator to estimate queue length and queue time at your entry points before event day.
When Is a Christmas Market at Peak Capacity?
Peak capacity comes from arrival rate and dwell time interacting over the course of the day. When arrivals outpace departures, occupancy climbs. The site reaches peak load when that occupancy hits its safe capacity. For most Christmas markets, peak attendance regularly occurs from late afternoon through early evening, with visitor numbers increasing significantly from Friday through Sunday and the heaviest crowds falling on the final full weekend before Christmas (around 19–20 December). The practical approach is to model your expected arrival rate and dwell time using OnePlan's arrival calculator, identify the hours when the site is most likely to be at or near capacity, and plan staffing, barrier placement, and entry management around those windows rather than treating capacity as a single number that applies all day.
How Long Do Christmas Markets Typically Last — and Why Does It Matter for Planning?
Dwell time, meaning how long a visitor stays at the market, is one of the two variables that determine peak occupancy alongside arrival rate. Longer dwell times mean more people are on site at any given moment for the same number of arrivals, so a market where visitors stay for hours will generally carry a higher occupancy than one where they pass through quickly. For planning purposes, dwell time also determines how long queues at popular stalls will be. A visitor who stays longer is more likely to visit multiple stalls and join multiple queues. When modeling your site, use your best estimate of average dwell time alongside your expected arrival rate to predict when the site will be fullest and how long queues at your highest-demand stalls are likely to run.
What Sells the Most at Christmas Markets — and Why Does It Matter for Crowd Flow?
Hot food and drink, including glühwein, bratwurst, and similar items, usually drive the longest queues. These stalls often become informal gathering points as people wait, eat, and socialize. Placing them away from entries and main intersections, and giving each one a dedicated queue lane, keeps the busiest lines from blocking your primary walkways and helps the whole site keep moving.