
Written by: Paul Foster, Founder, CEO, OnePlan
Key takeaways for public market vendor maps
- A public market vendor placement map is a to-scale, numbered diagram that serves vendors, city departments, and market managers with precise stall locations, safety documentation, and a reusable template.
- The seven-step workflow covers stall count and footprint, numbered aisles and emergency paths, vendor category grouping, infrastructure placement, crowd flow validation, Bill of Quantities export, and live map sharing for permits and future reuse.
- Common challenges such as inaccurate layouts, version-control issues, underestimated infrastructure counts, and stakeholder misalignment are solved by building on a live satellite map with to-scale objects and a single shared plan.
- Evaluation criteria for planning tools include live geo-accurate base layers, automatic Bill of Quantities generation, multi-user collaboration, print-ready exports, and reusable templates that remove the need to rebuild each cycle.
- OnePlan enables market managers to create accurate, compliant vendor placement maps in under an hour while streamlining permitting and vendor coordination, and you can see how OnePlan streamlines permitting and vendor coordination in a 15-minute demo.
Step-by-step workflow to build a public market vendor placement map
The seven steps below apply to any outdoor or indoor public market, regardless of size or location. Each step names the objective, lists required inputs, flags key decisions, and notes common trade-offs. Follow local regulations and consult the relevant authorities, including fire, police, and licensing, at every stage, because requirements vary by jurisdiction.
- Set stall count and footprint. Confirm the total number of vendor stalls and the usable area of the site before placing a single object. Required inputs include the site boundary dimensions, any fixed obstacles such as trees, utility boxes, and permanent structures, and the standard stall size you intend to offer. A common outdoor market stall is 10 ft × 10 ft. The key decision is whether to offer uniform stall sizes or a tiered mix. The trade-off is that uniform sizes simplify permitting and vendor communications but may underuse irregular corners of the site. In OnePlan, outline the site boundary on a live satellite map and use the area calculator to confirm usable square footage instantly, without a tape measure or a site visit.
- Lay out numbered aisles and emergency paths. Draw the aisle grid before assigning any stalls. Main thoroughfares and secondary paths require sufficient width to prevent bottlenecks and allow safe circulation. Emergency vehicle access routes must be at least 20 ft wide and kept completely unobstructed. Number every stall using a zone-based scheme, for example Zone A stalls 1–50 and Zone B stalls 51–100, so that late additions or reassignments do not require renumbering the entire layout. Lock the numbering scheme before producing any signage, vendor tags, or permit documents, because mismatches between the map and physical markers cause operational errors on setup day. The key decision is sequential versus zone-based numbering. The trade-off is that sequential numbering is simpler for small single-area markets, while zone-based numbering scales better for markets with 50 or more stalls.
- Group vendors by category. Cluster vendor types to improve shopper flow and simplify compliance. Spreading anchor stalls throughout the site rather than clustering popular vendors in one area maximizes foot-traffic distribution. Food vending should be clustered near water, drainage, seating, and waste collection points to support hygiene and servicing. Category grouping also determines which permitting pathway applies to each vendor. For example, food vendors typically require a Temporary Food Event permit, while craft vendors require a local business certificate, and requirements vary significantly by state and municipality, so always verify with local authorities. The key decision is how tightly to cluster food versus non-food vendors. The trade-off is that tight clustering simplifies utility runs but can create congestion at peak times.
- Place restrooms, hand-washing stations, power, and waste. Mark all fixed infrastructure on the map before finalizing stall positions. Fixed site features to mark first include power drops, water access, restrooms, and first aid stations, as well as no-block zones such as hydrants, fire lanes, and accessible routes. Vendors requiring electricity for equipment such as refrigerators or ovens must be placed near power sources, with no extension leads crossing walkways. A centrally located first-aid station and fire extinguishers positioned at regular intervals, especially near food vendors and generators, are standard infrastructure requirements for market layouts. In OnePlan, drag and drop toilets, generators, hand-washing stations, waste points, and first-aid markers directly onto the to-scale map. The auto-generated Bill of Quantities then counts every item placed, so you know exactly how many portable restrooms and power distribution boards to order before you contact a single supplier.
- Calculate aisle widths and crowd flow. Validate every aisle against your expected peak attendance before locking the layout. Maintain at least 8 ft between facing booth tables in high-traffic areas. ADA Standards for Accessible Design require a minimum 36-inch clear width wherever an aisle runs between fixed fixtures, and you should confirm the applicable standard with your local authority, because requirements vary. Use OnePlan’s standing crowd capacity calculator to outline each zone and check that no area is over-capacity at your expected peak. For arrival and exit flow, OnePlan’s free calculators at calculators.oneplan.io/arrival and calculators.oneplan.io/exit/calculator estimate queue length, queue time, and exit capacity based on your crowd size and exit widths. The key decision is how wide to set secondary aisles relative to main thoroughfares. The trade-off is that wider secondary aisles improve flow but reduce the total number of stalls that fit the footprint.
- Export the Bill of Quantities for vendors and contractors. Export the auto-generated Bill of Quantities as an Excel or CSV file once the layout is finalized. This turns every object on the map, including stalls, barriers, toilets, generators, and signage, into a structured inventory list with counts and dimensions. Accurate to-scale event diagrams allow planners to account for occupancy limits, accessibility requirements, traffic flow, and aisle spacing as part of the design process rather than as a final compliance check. Send the Bill of Quantities to contractors for procurement and to vendors as a confirmation of their stall number, dimensions, and setup window. Finalize booth assignments at least two weeks before the event and communicate them to vendors at least one week prior, including booth number, dimensions, setup time window, load-in instructions, and a marked venue map to reduce day-of disputes.
- Share the live map with city departments and reuse it each season. Export a high-resolution PNG map, up to A0 and print-ready, for permit submissions and stakeholder presentations. Share a live, view-only link with city departments, fire marshals, and police so every authority always sees the current version without anyone resending files. Reusable event layouts and venue templates reduce planning time while maintaining consistency across events by allowing teams to save configurations and focus on event-specific adjustments rather than rebuilding diagrams from scratch. In OnePlan, save the completed plan as a reusable template. Next year, open the same map, update stall assignments, adjust infrastructure counts, and export a fresh permit package without starting over. Eagle Mountain City reduced event planning from 8–10 hours to a few hours per event and reported a 5x return on investment by replacing separate stakeholder maps with one comprehensive OnePlan layout shared across departments.
Choosing tools and frameworks for vendor placement maps
Most market managers currently build vendor placement maps in one of two ways. They either work manually in PowerPoint, Excel, Canva, Photoshop, Google Maps, or internal static, top-view screenshots and plan files, or they commission CAD drawings from a specialist. Neither approach serves a recurring public market well.
Manual tools are fast to start but produce layouts that are not to scale. The Cheese & Chilli Festival states: “With OnePlan you can create accurate, detailed and professional looking event plans, without the need for a degree or design engineer.” CAD software is accurate but expensive, carries a steep learning curve, and produces static files that require a specialist to update, which is a poor fit for a market that runs monthly or annually with a small staff.
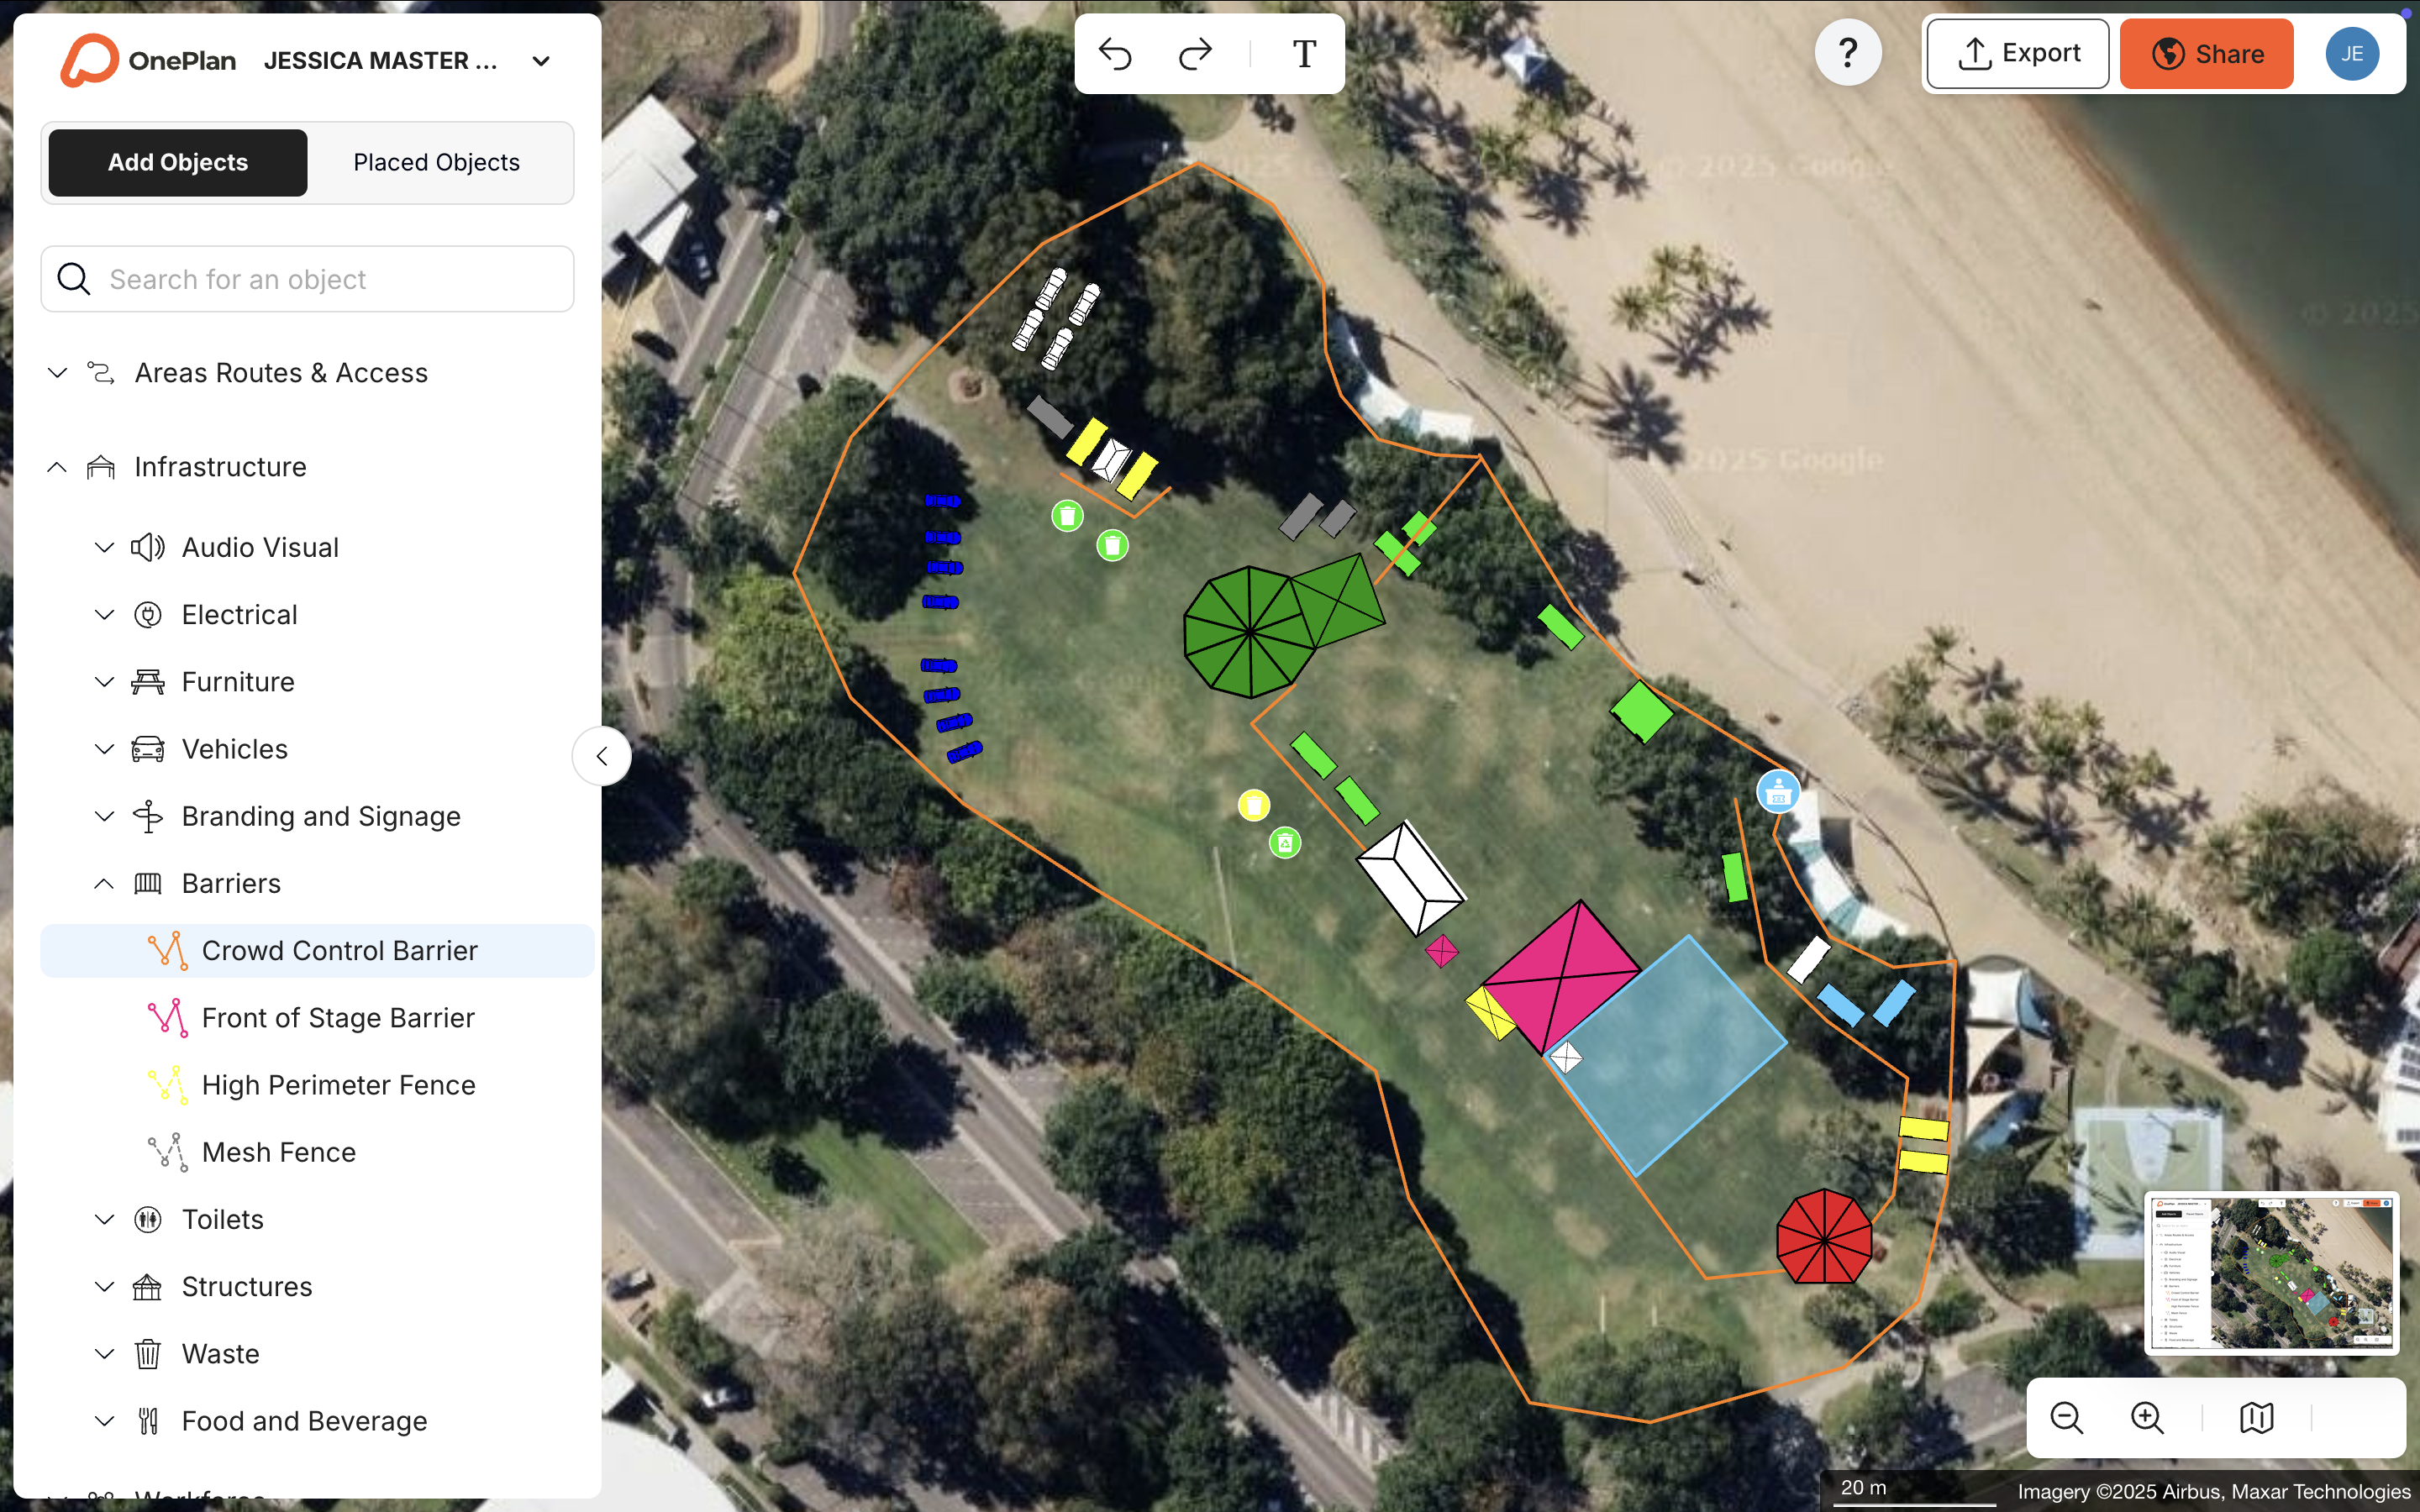
A collaborative, map-based workflow sits between these two extremes and suits recurring markets. Evaluation criteria worth applying when choosing a tool include:
- Is the base layer a live, geo-accurate satellite or street map, or a static screenshot?
- Do objects placed on the map stay to scale as you zoom?
- Does the tool auto-generate a Bill of Quantities from the layout?
- Can multiple departments view and edit the same plan simultaneously?
- Can the plan be exported as a print-ready, high-resolution file for permit submissions?
- Can the layout be saved and reused for the next market cycle without rebuilding from scratch?
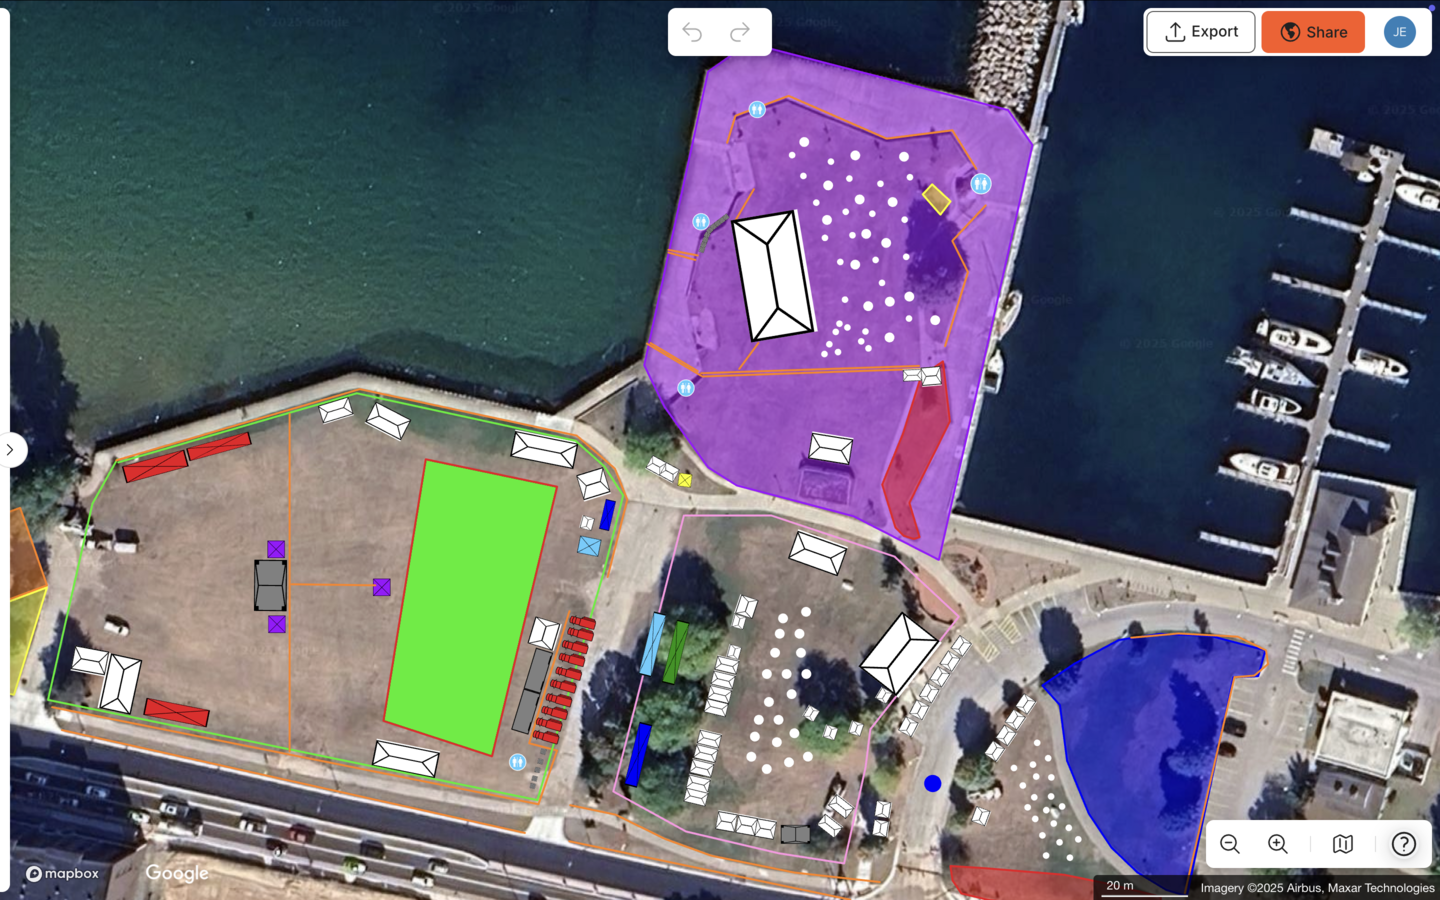
Common challenges and troubleshooting for public markets
Four problems recur across public market planning teams, regardless of market size.
Inaccurate layouts that do not match the physical site. When maps are built on static screenshots or non-scale grids, stalls that look correct on paper do not fit on the ground because the underlying image does not maintain consistent scale as you zoom or move across the site. Building on a live satellite map solves this by anchoring every object to real-world coordinates, so a 10 ft × 10 ft stall occupies exactly that footprint in both the digital plan and the physical site before a single tent peg goes in. The City of Greater Dandenong previously created site plans using Microsoft Word or PDFs with added symbols, which featured outdated maps, non-scale layouts, and imprecise emergency location markings, problems that a to-scale, map-based workflow eliminates.
Version-control chaos. When the map lives in an emailed file, different departments, including events, public works, fire, and police, each end up working from a different version. A single live plan with a shareable view-only link means every authority always sees the current layout, not last month’s draft.
Underestimated infrastructure counts. Ordering too few portable restrooms or too little fencing is a common and costly mistake when infrastructure is counted by eye from a non-scale map. An auto-generated Bill of Quantities that counts every object placed on the map removes guesswork and gives contractors an accurate procurement list before the market opens.
Stakeholder misalignment. The single biggest source of post-event complaints from vendors is often not fees or rules, it is booth placement. When vendors do not understand why they received a particular spot, they often assume favoritism or poor planning instead of recognizing logistical constraints. Sharing a numbered, to-scale vendor placement map with every vendor before setup day makes the layout logic visible. Vendors can see their stall in context, understand aisle flow and infrastructure placement, and recognize that assignments follow a system rather than arbitrary decisions. This transparency reduces disputes and builds trust. OnePlan’s view-only sharing and one-click collaboration make it straightforward to involve vendors in the process and keep everything in one system.
Frequently asked questions about vendor placement maps
How long does it take to build a public market vendor placement map from scratch?
For a market with 30–50 stalls on a site you already know, a complete to-scale vendor placement map, including stall numbering, aisle layout, infrastructure placement, and a Bill of Quantities, typically takes two to four hours in a purpose-built tool like OnePlan. Markets with 100 or more stalls or complex multi-zone layouts may take longer on the first build, but the same plan can be reused and updated in a fraction of that time for subsequent market cycles.
Who needs access to the vendor placement map, and how do I share it?
At minimum, the map should be shared with vendors so they know their stall number, dimensions, and load-in route, with city departments such as public works and parks, and with any fire or police authority involved in permitting. A high-resolution exported PNG works for permit submissions and printed handouts. A live, view-only link works for departments that need to check the current layout without editing it. Vendors benefit from receiving a marked map at least one week before the market, including their booth number, setup time window, and load-in instructions.
What documentation does a vendor placement map need to include for a permit submission?
Permit requirements vary by city and state, so always confirm with your local authority. As a general guide, most permitting bodies expect a to-scale site map showing stall positions with unique numbers, aisle widths, emergency vehicle access routes, fire extinguisher and first-aid locations, restroom and hand-washing station positions, power and generator placement, and entry and exit points with accessible routes marked. A Bill of Quantities listing infrastructure counts supports contractor coordination and can accompany the map as a supporting document. OnePlan exports print-ready maps up to A0 size and Bill of Quantities reports as Excel or CSV files, both suitable for permit packages.
How do I update the vendor placement map when the same market runs again next year?
Save the completed plan as a reusable template at the end of each market cycle. The following year, open the same map, update stall assignments to reflect new vendor applications, adjust infrastructure counts if the market has grown or shrunk, and export a fresh permit package. Because the base layer is a live satellite map and every object stays to scale, the geometry of the layout remains accurate without any manual re-measurement. Teams that adopt this workflow typically find that repeat-market planning takes a fraction of the time required for the first build.
Can a small weekly market use the same workflow as a large seasonal market?
The same seven-step workflow scales for both small and large markets. A small weekly market with 20 stalls can complete steps one through seven in under an hour and reuse the same plan every week with minor updates. A large seasonal market with 150 or more stalls across multiple zones benefits from the same workflow but invests more time in zone-based stall numbering, multi-category vendor grouping, and infrastructure planning. OnePlan is free for your first event, up to 25 objects, so small markets can start immediately without a budget commitment, while larger markets can scale up as needed.