
Written by: Paul Foster, Founder, CEO, OnePlan
Key Takeaways
- Event planners face rising safety scrutiny and need collaborative, map-based tools that connect crowd density figures to real site geometry, infrastructure, and traffic flows.
- Traditional methods like spreadsheets, screenshots, and point-and-click estimators produce isolated numbers that lack version control, collaboration features, and permit-ready documentation.
- Effective practice means calculating density zone by zone against net usable area, maintaining version control, and linking density mapping with egress, traffic, and infrastructure planning.
- Integrated professional platforms outperform free estimators when events involve multiple stakeholders, permit reviews, recurring cycles, or infrastructure procurement.
- OnePlan delivers a live, to-scale site plan that ties crowd capacity calculations to infrastructure and traffic, enabling real-time collaboration and permit-ready outputs; book a demo to see how it streamlines your next event.
Executive Summary: How This Guide Helps Your Planning
This guide supports event organizers, safety officers, and local government planners who need accurate, repeatable crowd density mapping as part of a complete site plan, not as a standalone calculation.
It covers the following areas:
- A decision framework for selecting the right crowd density tool based on event scale, team size, and approval requirements
- A comparison of current planning methods and their practical limitations
- Best practices for accurate, repeatable density mapping
- An implementation readiness checklist
- A crowd density standards reference table
- A tool comparison matrix
- A step-by-step capacity calculation workflow
- Dedicated sections on density guidelines and modern counting methods
Start your first event free in OnePlan or book a 15-minute demo to see the platform in action.
Decision Framework for Crowd Density Tools
Tool choice rests on three trade-offs that shift with event scale, team size, and the approval process.
Speed vs. accuracy. Free point-and-click estimators return a number in seconds but rely on assumptions the planner supplies manually. Integrated platforms take longer to set up but produce figures tied to actual, to-scale site geometry, which stand up in permit reviews and safety meetings.
Flexibility vs. standardization. One-off events with a single organizer can often work with a lightweight tool. Multi-site, recurring, or multi-stakeholder events need version control, shared access, and consistent methodology across every iteration.
Simplicity vs. technical depth. Small community events may need only a basic area-and-density calculation. Large festivals, road events, and stadium operations need density figures integrated with traffic flow, infrastructure placement, egress modeling, and a Bill of Quantities for procurement.
These three trade-offs converge on a single practical rule. If your crowd density calculation needs to survive a permit review, a safety authority meeting, or a multi-department sign-off, it needs to live inside a to-scale site plan, not in a separate spreadsheet or screenshot. That requirement pulls you toward accuracy over speed, standardization over flexibility, and technical depth over simplicity.
Current Planning Methods and Their Limitations
Manual spreadsheets and screenshots. The majority of event organizers still plan in PowerPoint, Excel, Canva, Photoshop, Google Maps, or internal static, top-view screenshots and plan files. Many teams estimate crowd density by eye or calculate it in a separate spreadsheet, then manually reconcile it with a site layout that is not to scale. Version control quickly breaks down as files move by email, and departments end up working from different plans.
Point-and-click free estimators. Tools like MapChecking allow planners to outline an area on a map and apply a density assumption to generate a headcount estimate. They are fast and accessible but produce a single number with no connection to infrastructure placement, traffic flow, egress capacity, or permit documentation. They also lack version control, collaboration features, and outputs that integrate with a full site plan.
Integrated professional platforms. Platforms built specifically for event site planning place crowd density calculations inside a to-scale, map-based plan that also handles infrastructure, traffic, staffing, and Bill of Quantities generation. The density figure ties directly to the actual geometry of the space as drawn on the map, not to a manually entered assumption. Changes to the layout update the capacity figure automatically, and every stakeholder works from the same live plan.
Best Practices for Accurate, Repeatable Density Mapping
Spatial accuracy first. Venue capacity calculations must deduct areas occupied by permanent or temporary structures such as stages, sound towers, production areas, and first aid posts, and credit non-viewing or circulation spaces at reduced densities before determining occupant load. A crowd density figure calculated against gross site area rather than net usable area will overstate safe capacity.
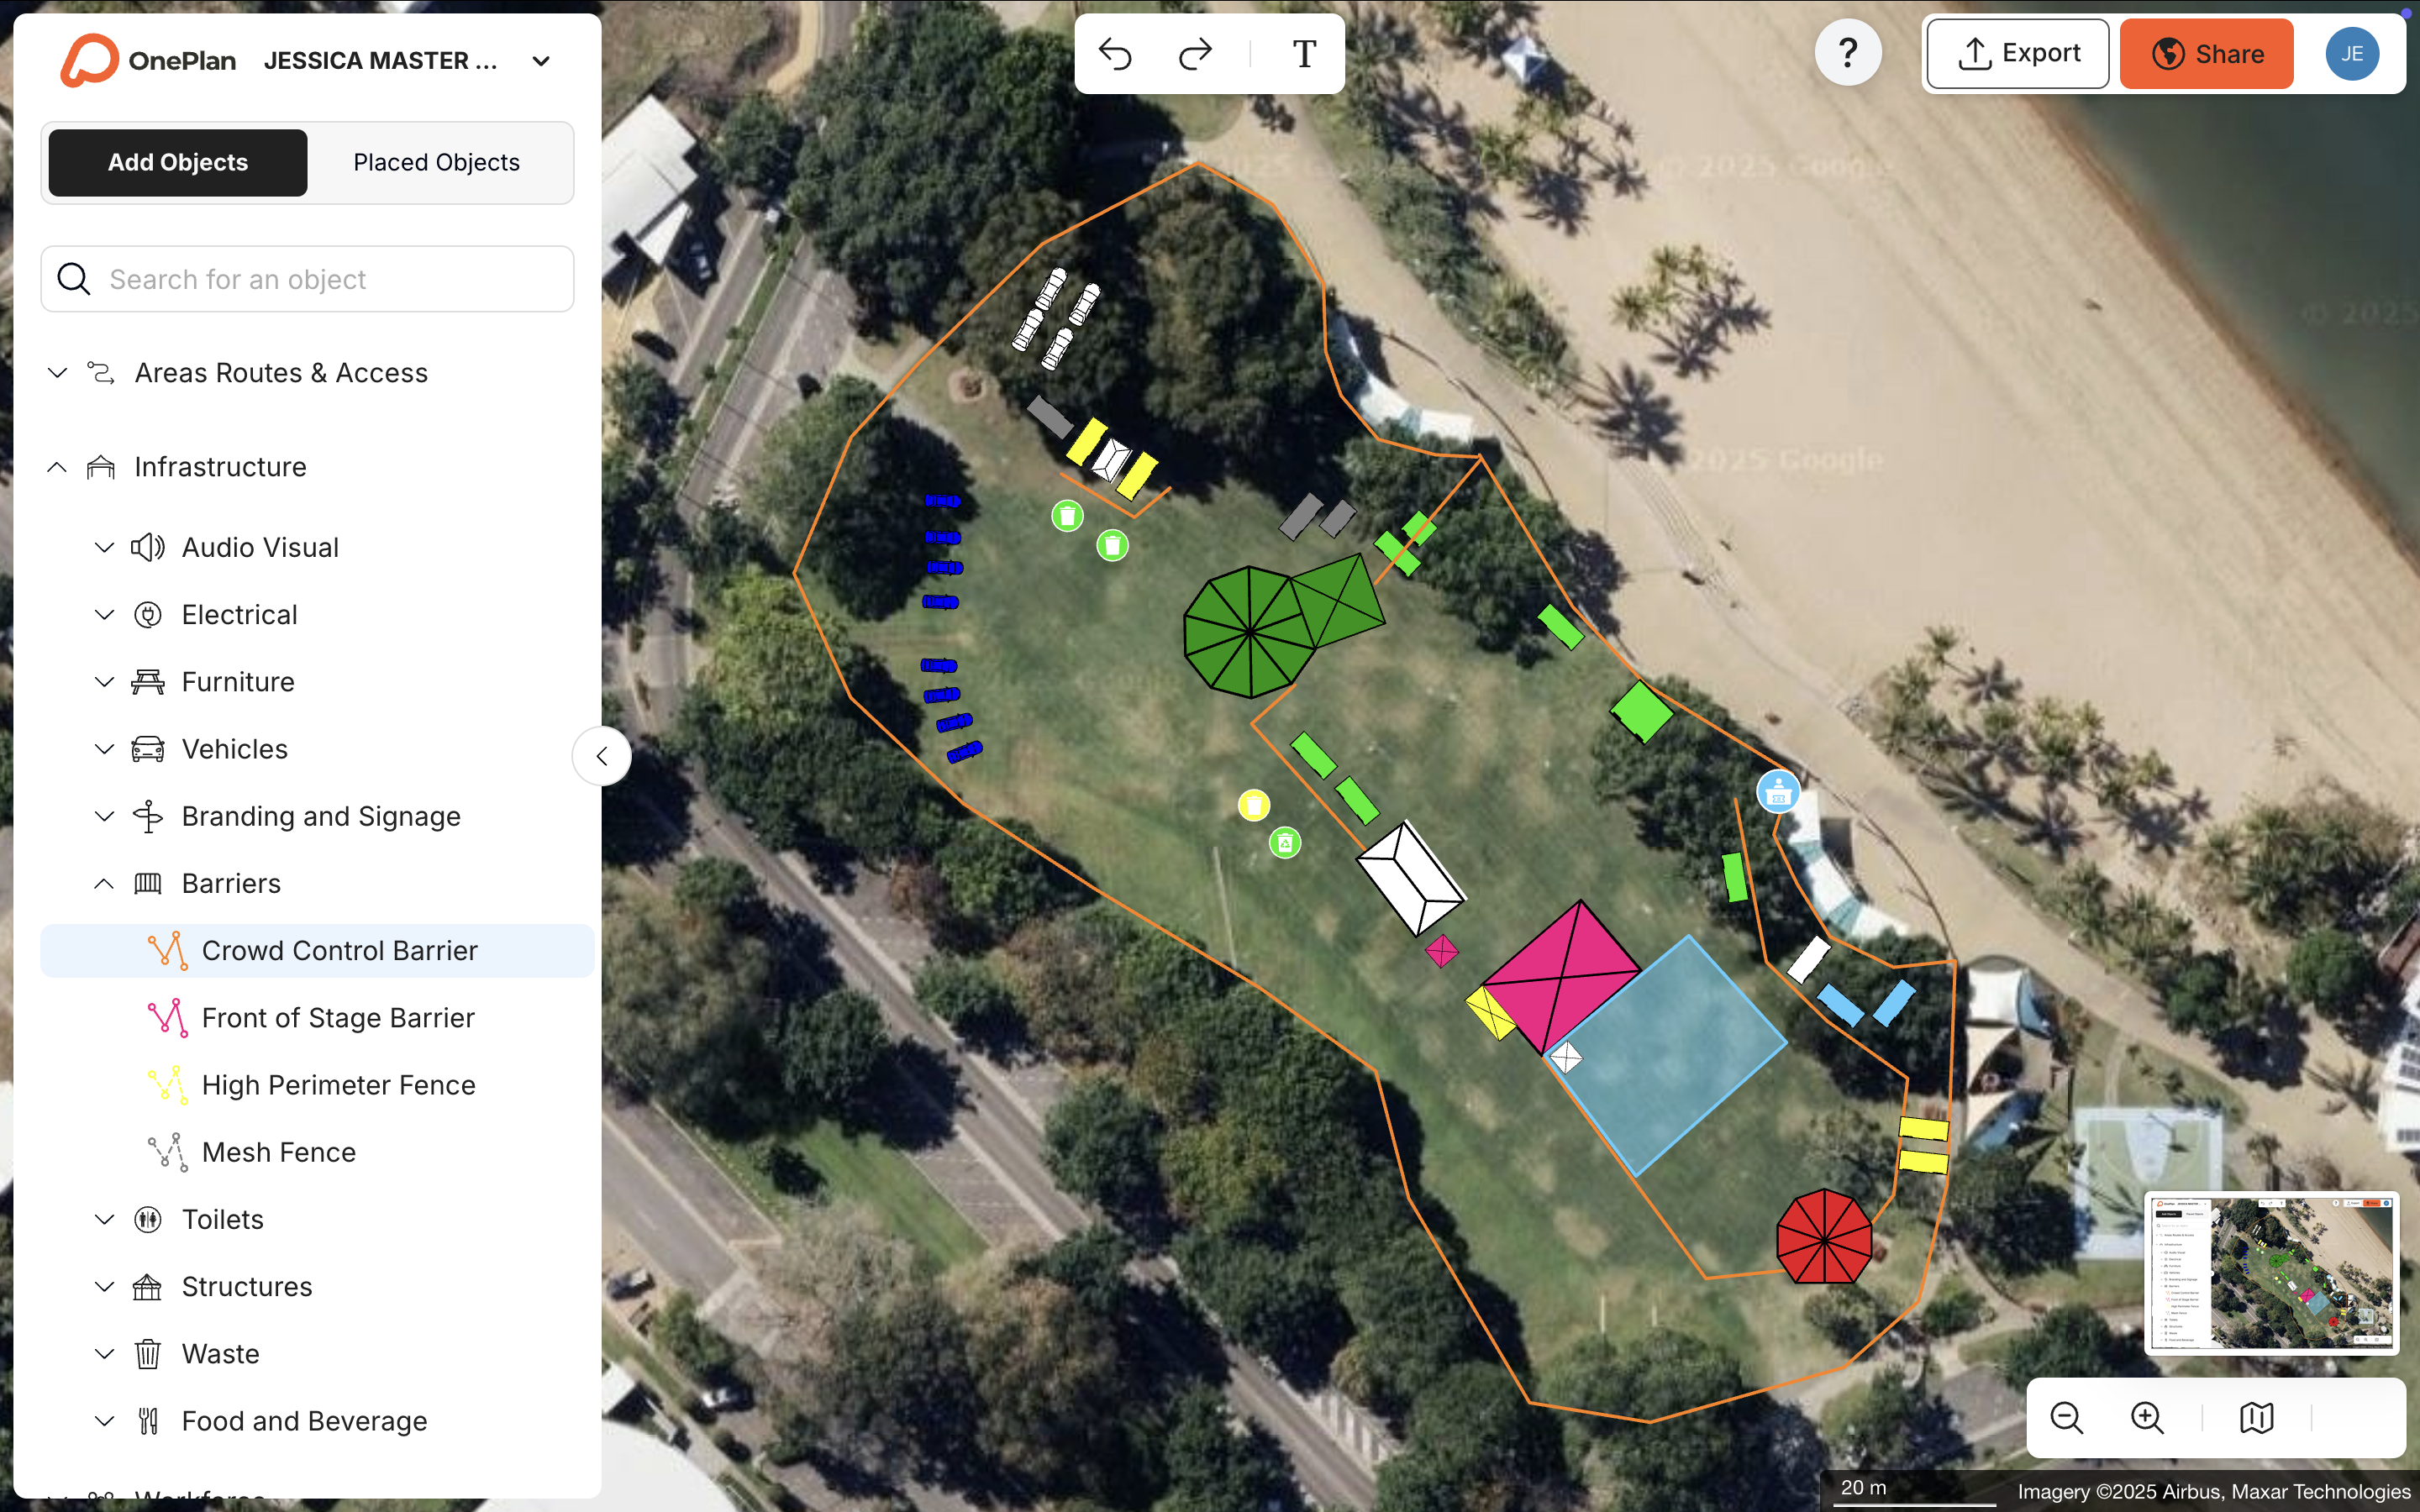
Zone-by-zone calculation. Venue capacity planning requires breaking the site into operational zones and calculating usable space in each by subtracting square footage occupied by stages, vendor footprints, infrastructure, barrier placements, restricted areas, and geometrically inaccessible zones from total area before dividing by target density. A single site-wide figure hides dangerous hotspots.
Version control and documentation readiness. Plans that exist as emailed PDFs cannot support a live permit review or a real-time safety meeting. Every revision needs to be traceable, and every stakeholder needs to view the same current version.
Integration with egress and traffic planning. Transition zones such as doorways, corridor narrows, ramp entries, merge points, and concourse-to-seating junctions generate density spikes and require specific attention in site layout design because they change crowd speed, direction, or density. Crowd density mapping that ignores egress geometry produces plans that look safe on paper but fail on event day.
Common pitfalls to avoid:
- Calculating density against gross area rather than net usable space
- Treating crowd density as a single site-wide figure rather than a zone-by-zone calculation
- Keeping density estimates in a separate document from the site plan
- Failing to update density figures when the site layout changes
- Sharing outdated plan versions with safety authorities or permit reviewers
Implementation Readiness Checklist for Your Team
Confirm these points before selecting or switching to a crowd density mapping tool.
- Team structure: Identify a designated lead who will own the plan and invite other departments and stakeholders.
- Data availability: Confirm whether you have accurate site dimensions or need to measure remotely using a map-based tool.
- Stakeholder involvement: List which departments and external parties, such as traffic, fire, medical, and local authority, need access to the plan and in what format.
- Approval process: Check whether your permit or safety review requires a to-scale site plan with documented capacity figures.
- Recurring events: Decide whether you will reuse this plan year on year and whether your tool supports reusable templates.
- Infrastructure procurement: Confirm whether you need a Bill of Quantities output to order fencing, barriers, and other infrastructure accurately.
If your answers point toward multi-stakeholder access, to-scale accuracy, and permit-ready documentation, a purpose-built integrated platform fits your needs.
Before you compare tools and workflows, ground your planning in the density thresholds that underpin safe capacity decisions. The next table gives the reference points you will apply when you calculate zone-by-zone capacities.
Crowd Density Standards Reference Table
The following table summarizes widely referenced density thresholds from recognized crowd science and safety sources. These figures are provided for reference only. Requirements vary by region, venue type, and event scale, so always consult local regulations and the relevant authorities (fire, building, licensing) for your specific jurisdiction.
| Density (sq ft per person) | Approximate Condition | Typical Use Case / Notes | Source Reference |
|---|---|---|---|
| ~24.7 sq ft per person | Normal walking speed, free movement | Circulation routes, low-density zones | Fruin (1993) |
| 10–15 sq ft per person | Free movement, comfortable spacing | Vendor rows, walkways, free-movement areas (NFPA Life Safety Code) | NFPA / Towerhouse Global |
| ~7 sq ft per person | Standing general admission, active management advised | Outdoor standing events, prime viewing area in front of stage | Fruin (1993); Still (2014) |
| 5 sq ft per person | Maximum standing density (NFPA baseline) | Standing areas, NFPA Life Safety Code maximum | NFPA Life Safety Code |
| ~3 sq ft per person | Involuntary physical contact, jostling | Threshold most people resist in non-emergency situations | Fruin (1993) |
| Below 2 sq ft per person | Dangerous crowd forces, compressive asphyxia risk | Critical threshold, immediate intervention required | Fruin (1993) |
Tool Comparison: Free Estimators vs. Integrated Platforms
The matrix below compares the two primary categories of crowd density tool available to event planners. All feature assessments are based on publicly available product information.
| Feature | Spreadsheets / Screenshots | Free Point-and-Click Estimators (e.g., MapChecking) | OnePlan (Integrated Platform) |
|---|---|---|---|
| To-scale mapping | No | Partial (area outline only) | Yes, every object stays to scale on a live satellite or street map |
| Crowd capacity calculator | Manual formula only | Yes (single-zone estimate) | Yes, multi-zone and tied to drawn geometry, for example “7,000 people at one person per square metre in there” |
| Infrastructure and traffic integration | No | No | Yes, stages, barriers, fencing, traffic routes, and crowd areas on one plan |
| Bill of Quantities output | Manual spreadsheet | No | Yes, auto-generated, Silverstone used it to cut supplier spreadsheet exchanges |
| Real-time collaboration | No (emailed files) | No | Yes, one live plan for all departments, Eagle Mountain City eliminated separate maps for fire, police, and facilities |
| Cost | Free (but time-intensive) | Free | First event free (up to 25 objects), paid plans from about $75 per month |
After comparing features, you can move into a practical workflow that shows how these capabilities work together during pre-event planning.
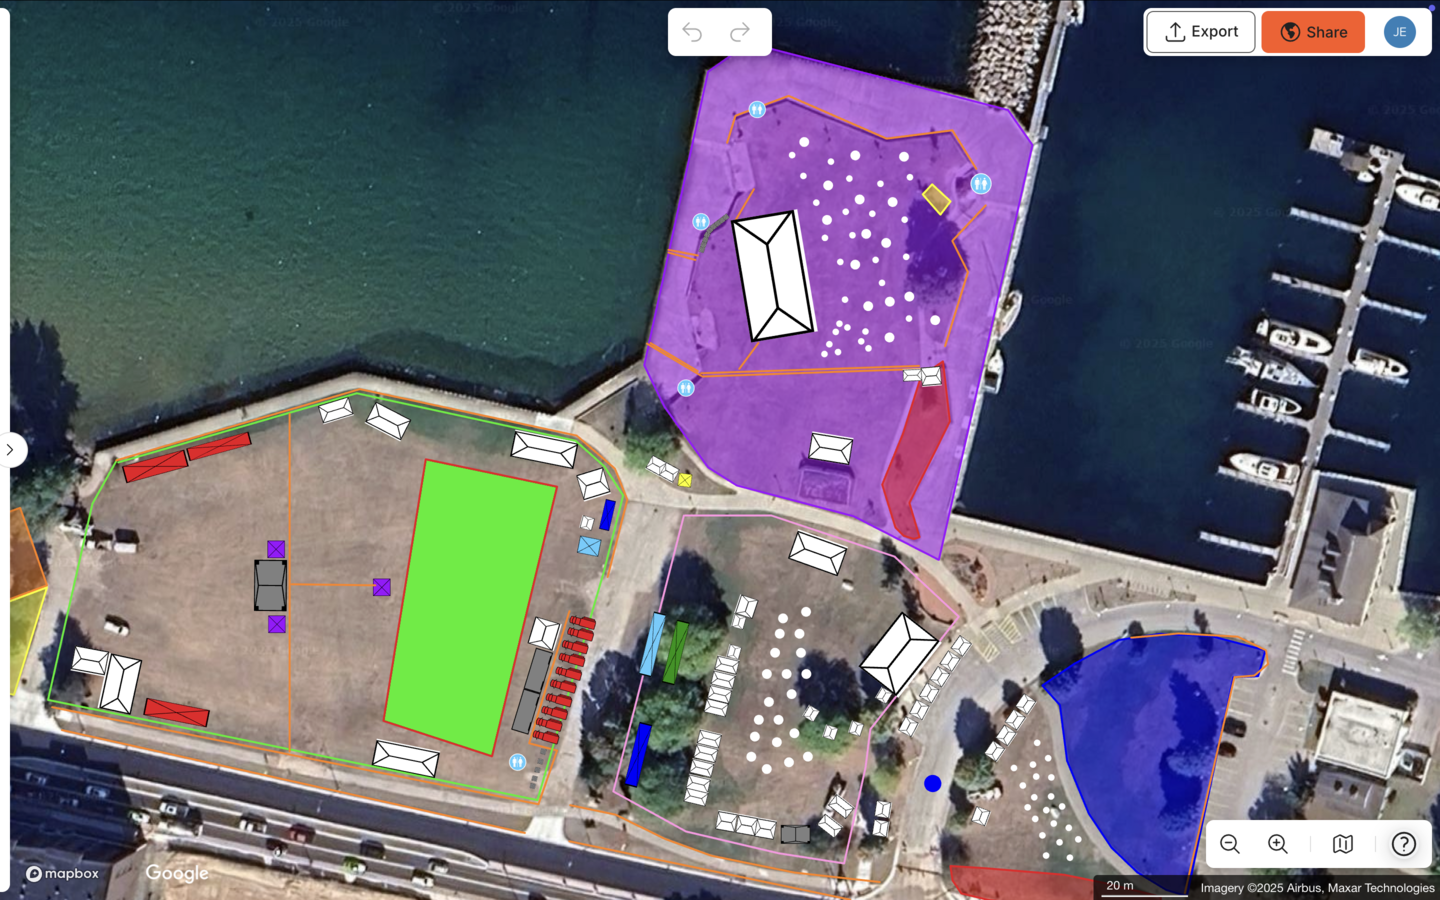
Step-by-Step Capacity Calculation Workflow
This workflow applies to pre-event planning and assumes a map-based platform where density calculations are tied to actual site geometry.
- Import or build your base map. Start with a live satellite or street map or import an existing site plan converted to .png. Scale it accurately before placing any objects.
- Define operational zones. Draw separate crowd areas for each zone such as stage front, general standing, vendor corridors, circulation routes, and emergency access lanes. Avoid a single site-wide figure.
- Subtract non-usable space. Place infrastructure objects such as stages, tents, barriers, first aid posts, and production areas on the map. When objects are to scale, the platform deducts their footprint from the available crowd area automatically.
- Calculate standing capacity per zone. Use the crowd capacity calculator to outline each crowd area and select a density. OnePlan’s calculator instantly returns the standing capacity for that zone. OnePlan’s crowd capacity calculator covers standing crowds only.
- Model arrival and exit flow. Use OnePlan’s free arrival calculator to estimate queue length and queue time for ticket checks and security screening, and the exit calculator to estimate exit capacity based on exit width, crowd size, and flow rate. These tools provide recommended starting points for any queue and flow estimate.
- Integrate traffic and parking. Add road closures, vehicle access points, and parking areas to the same plan. Use OnePlan’s traffic and transport tools to model ingress and egress flow and identify bottlenecks before event day.
- Generate permit documentation. Export a high-resolution site plan (up to A0, print-ready) and a Bill of Quantities for permit submissions, contractor briefings, and authority reviews.
- Share with stakeholders. Provide role-based access so operations, security, traffic, fire, and medical teams all work from the same live plan rather than separate versions.
The Beirut Marathon used this kind of integrated approach to cut approximately 20 pre-event site visits down to just one or two per year. Race Director Ehrabi Nael noted: “One of the features I like most right now is the crowd measurement feature. It’s so helpful to measure how many people you’re going to fit in a small area.”
Crowd Density per Square Meter Guidelines
Crowd density guidelines express how many people occupy a given area, most often in people per square meter (p/m²) or square feet per person. The ranges below appear consistently across recognized crowd science literature and safety guidance. All figures serve as reference points only, because applicable thresholds depend on event type, venue geometry, local regulations, and the authority having jurisdiction. Always consult local fire, building, and licensing authorities for your specific event and location.
As density increases to 2–3 p/m² (approximately 3.6–5.4 sq ft per person), movement slows and personal space reduces, marking the onset of conditions that require active management and the point at which flow rate begins to decrease even as more people enter the space.
Above 6 p/m² (approximately 1.6 sq ft per person), individual movement is eliminated, crowd compression can generate forces exceeding 4,500 Newtons, enough to bend steel railings, and compressive asphyxia becomes the primary lethal mechanism.
Apply the arrival and exit calculators mentioned in the workflow above to model queue and flow conditions at your chosen density, rather than relying on a single density figure applied across the whole site.
Modern Counting Methods and Technology Evolution
This guide focuses on pre-event capacity planning, which covers the calculations and site layouts you establish before attendees arrive. Understanding how real-time monitoring technology has evolved gives useful context for how crowd density management has matured as a discipline. The technologies below represent current practice for live event monitoring and currently sit mainly within reach of large-scale venues.
Crowd density mapping has moved well beyond manual clickers and visual estimates. Since 2023, four functional layers have converged to define the current state of the art: real-time sensing, AI-powered density estimation, environmental flow influencing, and digital twin simulation.
AI and computer vision. AI transforms video surveillance from passive observation into active analysis, detecting patterns and anomalies that human operators cannot identify in vast visual data streams. AI crowd density systems can generate color-coded heatmaps to visualize crowd concentration across venues. Occupancy monitoring compares current density levels against predefined safe capacity limits and triggers alerts when thresholds are approached.
Multi-sensor fusion. The standard for robust monitoring has shifted to multi-sensor fusion, combining cameras, IoT nodes, RFID, Wi-Fi, Bluetooth, and acoustic sensors to create richer situational awareness than single-sensor deployments. LiDAR sensors have become a viable option for large events due to significant cost decreases, providing accurate density and flow data that works in all lighting conditions.
Drone-based monitoring. Drone technology extends monitoring capabilities into areas no fixed camera can reach, using high-resolution cameras for real-time aerial mapping of crowd density during large-scale events. A 2025 Indian patent filing describes a drone-based smart crowd management and stampede prevention system combining AI with IoT sensors and aerial platforms to address blind spots in fixed-infrastructure monitoring.
Predictive modeling and digital twins. AI systems for crowd management can help predict congestion in advance and provide rapid alerts for dangerous crowd pressure or bidirectional flow conflicts. Simulation-based approaches that implement one-way corridors, controlled entry systems, and widened walkways can help reduce peak crowd density and bottleneck duration.
For most event organizers, real-time AI monitoring remains a technology deployed at major venues and large-scale events. Pre-event planning, where the site layout, zone capacities, and egress geometry are established before a single attendee arrives, remains the highest-leverage intervention available to any organizer at any scale and should be your primary focus.
Conclusion: Matching Your Event to the Right Planning Approach
The decision framework stays simple in practice. For one-off, small-scale events with a single organizer and no formal permit review, a free estimator may be sufficient. For any event that involves multiple stakeholders, a permit or safety authority review, recurring planning cycles, or infrastructure procurement, crowd density mapping needs to live inside a to-scale, integrated site plan.
Static or siloed planning methods no longer meet the safety scrutiny and coordination demands that event organizers face in 2026. Tools that served planners a decade ago, such as spreadsheets, screenshots, and point-and-click estimators, produce crowd density figures that cannot be verified against actual site geometry, cannot be shared in real time with every stakeholder, and cannot generate the permit-ready documentation that authorities increasingly require.
OnePlan has powered more than 200,000 events across 150 countries, from community fairs and local government events to Formula 1 circuits and the Paris 2024 Olympic Games. The SoulFest team cut planning time by 85%. Silverstone achieved a 13x ROI. Eagle Mountain City cut planning time by 70% and reported a 5x return on investment. The first event is free, with no payment details required.
Frequently Asked Questions
What is a crowd density map tool, and how does it differ from a simple capacity calculator?
A crowd density map tool calculates how many people can safely occupy a defined space based on its area and a chosen density figure. A simple capacity calculator performs the same arithmetic but in isolation, because you enter an area and a density and it returns a number. A crowd density map tool instead ties that calculation to an actual drawn space on a to-scale site plan. The area is measured from the map geometry itself, not entered manually, so the figure reflects the real shape of the space after infrastructure, stages, barriers, and restricted zones have been placed. OnePlan’s crowd capacity calculator works this way, because you draw a crowd area on the map, select a standing density, and the platform instantly returns the capacity for that zone. Since the calculation sits inside the site plan, it updates automatically when the layout changes and remains visible to every stakeholder working in the same plan.
How do I calculate crowd capacity for an outdoor event with multiple zones?
Start by dividing the site into distinct operational zones rather than calculating a single site-wide figure. Each zone, such as stage front, general standing, vendor corridors, circulation routes, and emergency access lanes, has a different density profile and risk level. For each zone, measure the net usable area by subtracting the footprint of any infrastructure placed within it, including stages, tents, barriers, and first aid posts. Then apply a density appropriate to that zone’s function and risk level. Sum the zone capacities to arrive at a total site capacity. For queue and flow estimates at entry and exit points, use OnePlan’s free arrival calculator at calculators.oneplan.io/arrival and exit calculator at calculators.oneplan.io/exit/calculator. These tools model queue length, queue time, and exit capacity based on the specific parameters of your event. Always verify your final figures against local regulations and the requirements of the authority having jurisdiction for your event location.
What are the most widely referenced crowd density thresholds for event safety planning?
Crowd science literature consistently references a set of density thresholds that describe how crowd conditions change as density increases. At low densities, movement is free and comfortable. As density rises toward the 2–3 people per square meter range, movement slows and personal space reduces, which signals the need for active management. At around 4 people per square meter, conditions become uncomfortable and intervention is warranted according to widely cited safety guidance including the UK’s Event Safety Guide. Above 6 people per square meter, individual movement is eliminated and compressive forces can reach dangerous levels. These thresholds are reference points drawn from recognized crowd science research, most notably the work of John Fruin and Professor G. Keith Still. They are not universal legal standards, because applicable limits depend on event type, venue geometry, and the regulations of the specific jurisdiction. Always consult local fire, building, and licensing authorities for your event.
How does OnePlan integrate crowd density mapping with the rest of event site planning?
OnePlan places the crowd capacity calculator inside a to-scale, map-based site plan. When you draw a crowd area on the map, the calculator uses the actual geometry of that drawn shape, not a manually entered figure, to return a standing capacity. Because the crowd area sits on the same plan as stages, barriers, fencing, vehicle access routes, parking areas, and staff positions, any change to the layout automatically affects the crowd area and its calculated capacity. The Bill of Quantities auto-generates from everything placed on the map, so infrastructure procurement ties directly to the same plan that produced the density figures. Stakeholders across operations, security, traffic, fire, and medical teams work from the same live plan rather than separate documents. For arrival and exit flow modeling, OnePlan’s free arrival and exit calculators provide queue length, queue time, and exit capacity estimates that complement the zone-by-zone capacity figures from the site plan.
What modern technologies are used for real-time crowd density monitoring at large events?
Real-time crowd density monitoring at large events now draws on several converging technologies. Camera-based analytics using CCTV and computer vision software remain the most widely deployed approach, generating density estimates and heat maps overlaid on site plans with alerts when predefined thresholds are exceeded. Multi-sensor fusion systems combine cameras with LiDAR, Wi-Fi, Bluetooth, RFID, and pressure sensors embedded in barriers to create a richer operational picture than any single sensor can provide. AI-powered systems analyze these data streams in real time, classifying crowd states, forecasting bottlenecks, and detecting dangerous pressure conditions, with some systems predicting congestion 5–10 minutes in advance. Drone-based monitoring extends coverage into areas no fixed camera can reach. For most event organizers, these technologies appear at major venues and large-scale events. Pre-event planning, which establishes accurate zone capacities, egress geometry, and infrastructure placement before the event opens, remains the most accessible and highest-leverage intervention.