
Written by: Paul Foster, Founder, CEO, OnePlan
Key Takeaways for Safer Game Day Flow
-
Game day crowd flow planning maps every phase of fan movement, from parking to seats and egress, using to-scale digital plans and modern monitoring technology to keep density safe and predictable.
-
Stadium operations succeed when gates, concourses, and buffer zones are sized correctly. Static PDFs often hide dangerous bottlenecks that to-scale digital planning reveals before game day.
-
The 4-phase fan journey (pre-arrival, ingress, circulation, egress) needs targeted tactics at choke points, merge zones, and wave-release sequences to prevent dangerous density spikes.
-
Buffer zones, separation lanes, and real-time monitoring with sensors and AI analytics give operations teams tools to respond instantly and keep crowds moving safely.
-
OnePlan replaces static drawings with a living, to-scale platform that unites every department. Book a demo to see how it streamlines stadium crowd flow planning.
How to Manage Crowd Flow at Stadiums
Picture your stadium as a plumbing system. Gates act as valves. Concourses function as pipes. Plazas, holding areas, and staggered-release zones work as pressure buffers. When every component is sized correctly and connected in sequence, the flow stays smooth. When one pipe is undersized, or a valve opens too fast, pressure builds, measured in people per square foot.
Ingress points, egress points, choke points, merge zones, and counterflow areas are the highest-priority risk locations in any stadium flow plan. They demand focused attention before the first fan arrives. Many operations teams still rely on static PDFs, CAD files, or spreadsheets that are not to scale. A concourse that looks wide enough on a printed drawing may be dangerously narrow at peak ingress. A gate configuration that worked for last season’s average attendance may fail at a sellout.
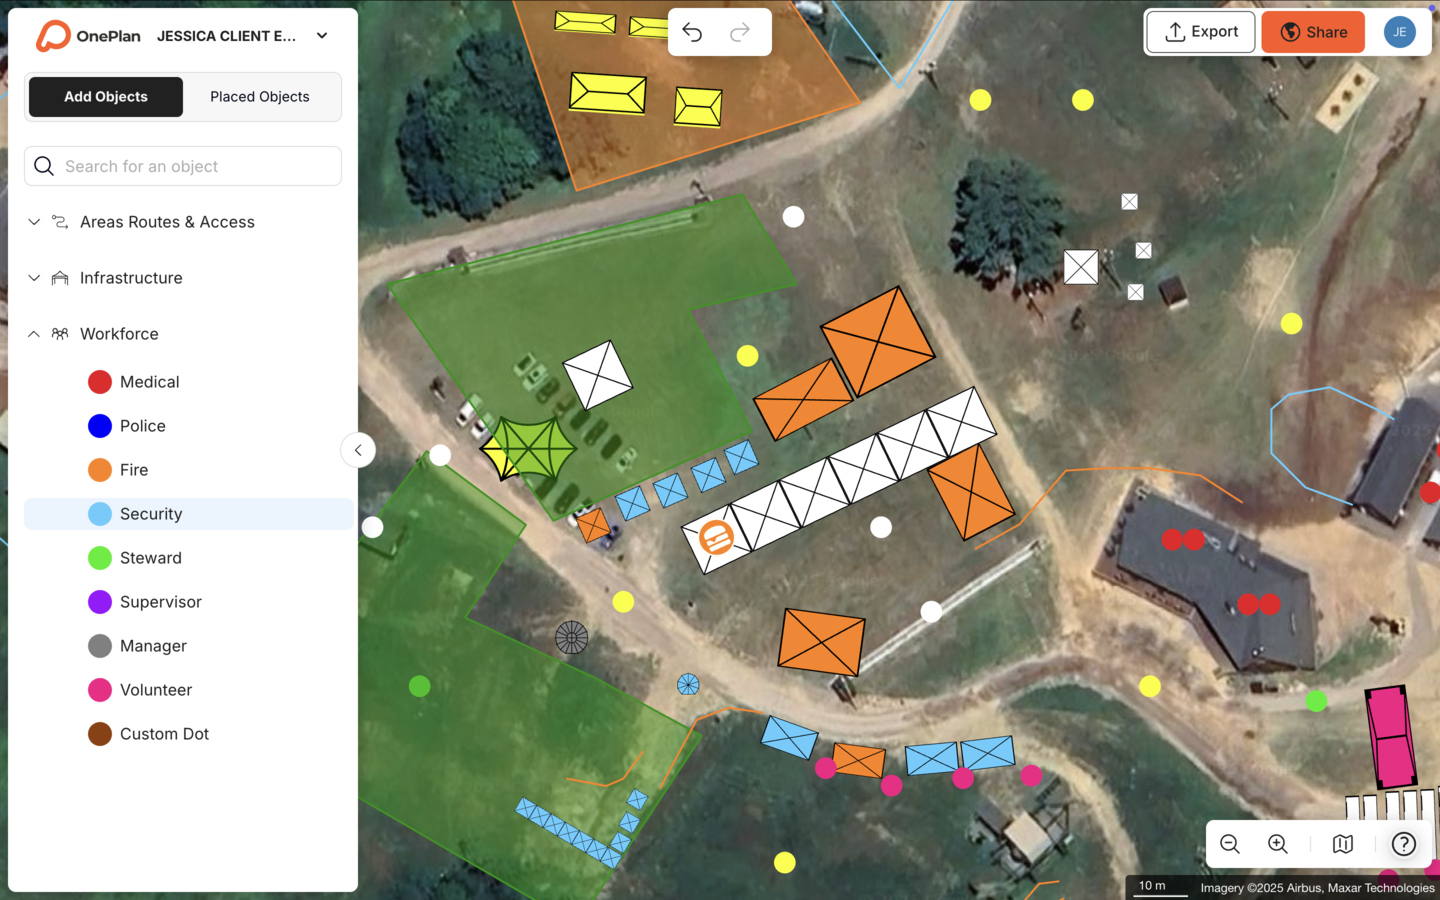
Accurate, to-scale digital planning prevents those failures. When every object, including barriers, signage, staff positions, and entry lanes, sits on a live satellite map at its true dimensions, bottlenecks appear on screen before they appear on the concourse. MSV uses OnePlan to digitally map venues, model traffic and crowd flows, and collaborate in real time across sites, replacing the guesswork that comes with static drawings. That same to-scale approach structures the four-phase fan journey framework below, so each phase maps specific choke points and flow tactics onto your live plan before game day.
The 4-Phase Fan Journey Map
Phase 1: Pre-Arrival Planning Outside the Stadium
-
Map all transport drop-off points, parking lots, and pedestrian approach corridors to scale.
-
Identify merge zones where pedestrian streams from different transport modes converge.
-
Publish gate assignments and parking directions in advance to distribute the arrival load.
-
Confirm compliance messaging, such as bag policy and prohibited items, reaches fans before they queue. Early compliance messaging prevents security screening from becoming the primary bottleneck during peak ingress.
Phase 2: Ingress at Gates and Screening Points
-
Design defined approach lanes before each screening point with barriers that separate counterflow streams. These lanes funnel fans toward screening without creating cross-traffic.
-
Size every gate for peak flow rate using timed entry, staggered admission windows, and one-way flow enforcement. The configuration that worked for average attendance will fail at a sellout.
-
Place staff at queue entry points to direct fans and prevent lane spillback before it reaches approach corridors.
-
Before game day, use OnePlan’s free arrival calculator to estimate queue length and wait time for ticket checks and security screening. If the calculator shows excessive wait times, open additional lanes or adjust gate opening times.
Phase 3: Circulation on Concourse Levels
-
Map concourse widths to scale and identify any narrows, ramp entries, or merge points where crowd speed, direction, or density changes. These transition zones generate sudden density spikes.
-
Designate dedicated circulation lanes that vendor queues cannot spill into. Concourse congestion is most often caused by queue spillback into circulation lanes rather than by overall attendee volume.
-
Post high-visibility directional signage at every decision point, including restrooms, concessions, and section entrances.
-
Position roving staff at known pinch points so they can redirect flow in real time.
Phase 4: Egress After the Final Whistle
-
Plan wave-release sequences by section to prevent simultaneous full-stadium exit.
-
Keep emergency vehicle access corridors clear and marked on the live plan.
-
Coordinate with transit operators on post-game shuttle and bus schedules before kickoff.
-
Use OnePlan’s free exit calculator to estimate exit capacity based on exit width, crowd size, and flow rate.
Buffer Zones and Separation Tactics Inside and Outside
Buffer zones act as pressure-relief valves in the plumbing model. They absorb surge, slow momentum, and give operations teams time to respond before density reaches dangerous levels. Barriers direct flow along planned routes, create queuing lanes that distribute density, separate counterflow streams, protect restricted areas, and provide psychological cues that guide crowd behavior.
Use these practical buffer-zone tactics for stadium operations:
-
Label every queue clearly. Clearly label queue purpose, define queue entrances with barriers, and preserve the dedicated circulation lanes described in Phase 3.
-
Separate counterflow streams. Arriving and departing fans should not share the same corridor without a physical or staffed separation.
-
Stage gate openings. Opening all gates at once creates a single peak surge. Staggered opening times spread arrival load across a longer window.
-
Hold zones at concourse entries. A short holding area before a narrow concourse section acts as a buffer that prevents compression downstream.
-
Wave-release at section exits. Releasing sections in sequence after the final whistle reduces simultaneous egress pressure on main concourses and exit gates.
-
Deploy modular signage for reroutes. Modular signage systems, portable queue control layouts, and quick-deploy closure systems handle reroutes, restricted access, and emergency flow control.
Columbus Crew’s Director of Guest Experience, Michael Beirne, describes the value of seeing the full picture in one place: “I enjoy being able to see the actual layout of the building and combine that from start to finish with roads, routing, and signage. It allows us to see what we’re really operating with, all in one place.” That unified view becomes critical during egress, where buffer zones and wave-release sequences must work together to meet life-safety standards.
Stadium Egress Planning for Life Safety
Egress is where game day crowd flow planning most directly intersects with life-safety standards. NFPA 101 requires the main entrance and exit of an assembly occupancy to accommodate at least one-half of the total occupant load (two-thirds for dance halls, nightclubs, discotheques, and festival seating). Requirements vary by jurisdiction and occupancy type, so always verify with your local authority having jurisdiction. The 8-minute egress window referenced in many stadium safety frameworks assumes those exit widths are unobstructed and that flow is managed, not spontaneous.
Use these key egress planning steps:
-
Map all exit gates and emergency corridors to scale on your live plan and verify widths against your occupant load.
-
Use OnePlan’s exit calculator to model exit capacity using actual exit widths, crowd size, and flow rate. Replace rough estimates with defensible figures.
-
Plan wave-release sequences by section and assign staff to hold positions until their section’s release cue.
-
Coordinate with local transit operators at least 30 days out. Build bus and rail schedules around your release sequence, not the other way around.
-
Mark emergency vehicle access corridors on the plan and confirm they remain clear of vendor equipment and temporary infrastructure.
-
Brief all stewards and security staff on the wave-release sequence and their individual trigger points before gates open.
The Canadian Football League uses OnePlan to plan multi-site events including the Grey Cup, with planners creating different layers so security teams can view routes and emergency exits as part of their operational workflow.
Model your wave-release sequence and exit capacity in OnePlan. Start free and build your egress plan to scale today.
Real-Time Monitoring and Adjustment Checklist
-
Pre-event baseline: Confirm all people-counting sensors, Wi-Fi tracking nodes, and CCTV analytics feeds are live and calibrated before gates open. These feeds provide the raw data for the threshold alerts you will set next.
-
Ingress threshold monitoring: Assign a control-room operator to watch gate density feeds and act on alerts. Real-time monitoring at entry and exit points enables threshold-based responses such as opening additional gates, redirecting signage, deploying stewards, or temporarily slowing admission when density approaches critical levels.
-
Concourse density alerts: Set alert thresholds in your monitoring system for concourse zones downstream of the gates you monitor. Multi-modal interventions that combine engineering controls, operational measures, real-time monitoring, and communication can reduce peak crowd density and bottleneck duration.
-
Half-time surge preparation: Brief concourse staff 5 minutes before the half-time whistle. Concession queues will expand rapidly, so confirm circulation lanes are clear before the surge begins.
-
Live plan updates: When a gate is redirected or a concourse is closed, update the live OnePlan map immediately so every team member, including operations, security, and medical, works from the same current picture. Columbus Crew’s approach: “We use OnePlan with team members, contractors, first responders, operations staff, and internal teams. Everyone can add their own layer, whether it’s staffing, equipment, or layout changes.”
-
Post-game transit coordination: Monitor transit feed data and adjust wave-release timing if buses or trains are delayed. A 10-minute hold on one section’s release can prevent dangerous compression at the transit hub.
-
Post-event debrief capture: Log bottleneck locations, gate performance, and density alerts directly in the plan as notes for next game day. A living plan improves with every event.
Arrival and Exit Calculators for Queue and Egress Planning
Guessing queue times and exit capacity builds bottlenecks into the plan before the first fan arrives. OnePlan offers two free calculators that replace guesswork with defensible, data-driven estimates.
The arrival calculator models estimated queue length and wait time for ticket checks and security screening based on your gate configuration and expected arrival rate. Use it to test whether your current gate count handles your sellout scenario or whether you need an additional lane open 90 minutes before kickoff.
The exit calculator uses exit width, crowd size, and flow rate to estimate exit capacity and total clearance time. Run it against your wave-release sequence to confirm each section can clear within your target egress window.
These tools work alongside OnePlan’s to-scale map, where every gate, barrier line, and concourse width is drawn at its true dimension. Ehrabi Nael, Race Director for the Beirut Marathon, says, “One of the features I like most right now is the crowd measurement feature. It’s so helpful to measure how many people you’re going to fit in a small area.” The same principle applies to every gate lane and holding area in your stadium.
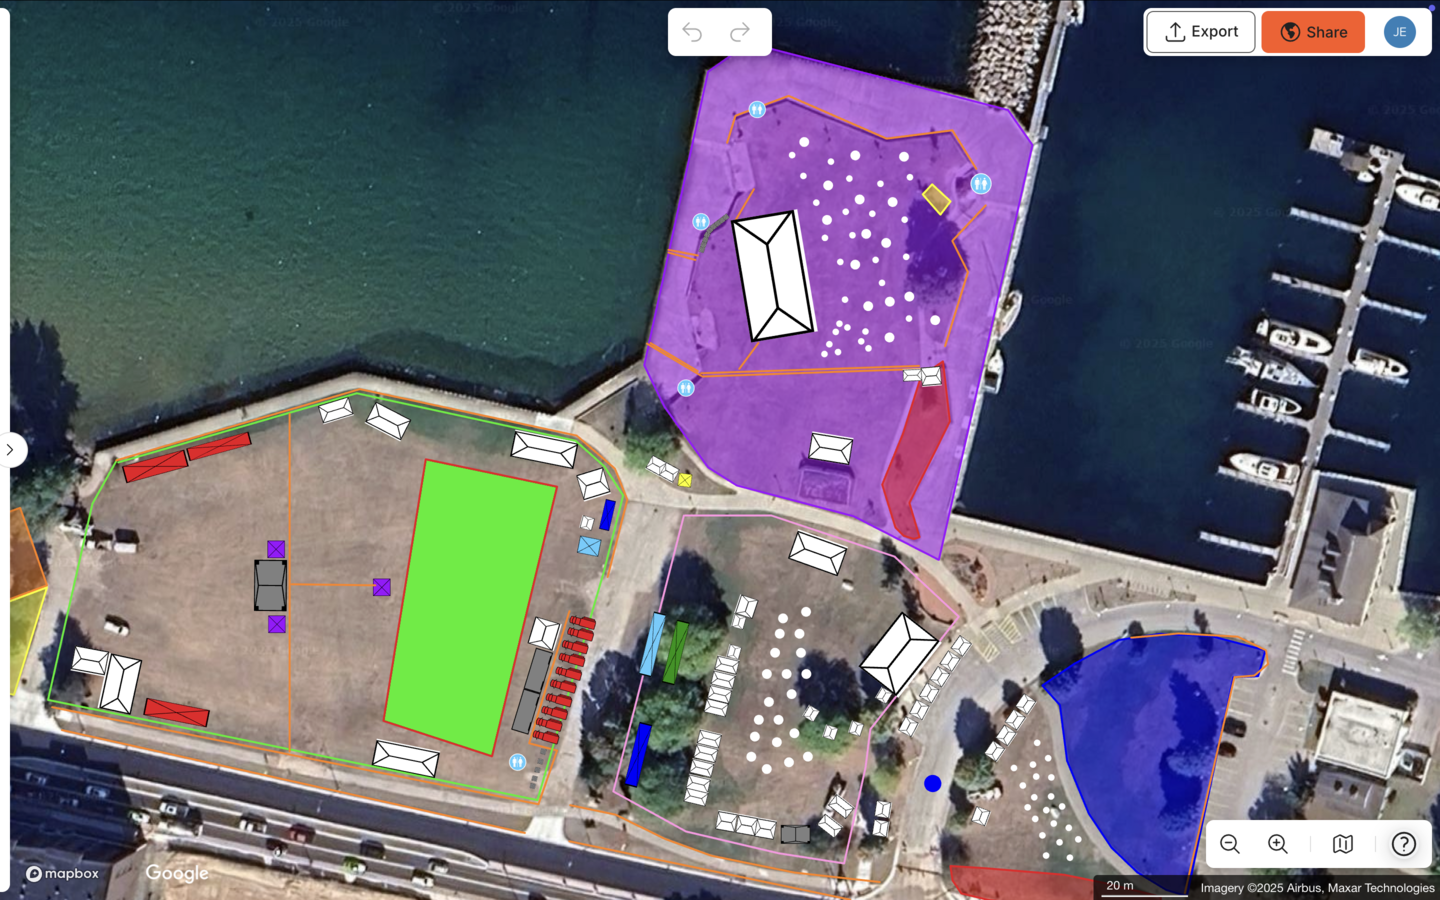
Tom Newton of Bearfoot Productions adds further context: “The calculations for crowd capacity and parking areas are great. It’s nice to have a visual shape on our plan that shows me I can get 7,000 people at one person per square metre in there.”
7-Step Game Day Crowd Flow Framework Recap
-
Build a to-scale base map. Import your stadium floor plan as a .png file into OnePlan, scale it onto the live satellite map, and plan on top of it. Every gate, concourse, and exit now sits at its true dimension.
-
Run the arrival calculator. Use the arrival calculator to model queue length and wait time for your peak ingress scenario before game day.
-
Map the 4-phase fan journey. Walk pre-arrival, ingress, circulation, and egress on the plan. Mark every merge zone, choke point, and transition area.
-
Design buffer zones and separation lanes. Place barriers, holding areas, and dedicated circulation lanes on the to-scale map. Confirm no vendor queue can spill into a movement corridor.
-
Plan wave-release egress. Use the exit calculator to model exit capacity. Assign section release sequences and staff trigger points.
-
Set up real-time monitoring. Confirm sensor feeds, assign a control-room operator, and set density alert thresholds before gates open. Update the live OnePlan plan as conditions change.
-
Debrief and update the living plan. After every game day, log what worked and what did not directly in OnePlan. The plan improves with every event and stays ready for the next one.
Silverstone manages planning for 9,000 contractors using OnePlan and reports a 13x ROI. The Jockey Club produces plans for events with over 100,000 attendees in days rather than weeks. The same platform, the same drag-and-drop tools, and the same living plan are available to your stadium operations team right now.
Put the seven-step framework into practice. Start your first event free or book a demo to see how Silverstone, Columbus Crew, and the Jockey Club plan at scale.
Frequently Asked Questions
What is the difference between ingress planning and egress planning for stadiums?
Ingress planning focuses on how fans arrive at and enter the venue, covering transport drop-off points, parking, pedestrian approach corridors, queue lane design, security screening, and gate configurations. The primary challenge is managing a compressed arrival window where a large percentage of fans arrive within 30 to 60 minutes of kickoff. Egress planning focuses on how fans leave safely and efficiently after the event, covering wave-release sequences by section, exit width and capacity, post-game transit coordination, and emergency vehicle access. Both require to-scale plans that reflect actual gate widths, concourse dimensions, and barrier placements. OnePlan’s free arrival calculator and exit calculator at calculators.oneplan.io are built specifically to model these scenarios before game day, replacing estimates with figures based on your actual venue geometry and crowd size.
How do buffer zones prevent crowd crush at stadium events?
Buffer zones are designated areas such as plazas, holding corridors, and staggered-release sections that absorb crowd momentum and prevent density from building to dangerous levels at choke points. They slow the rate at which fans reach a narrow point, giving the downstream flow time to clear before the next wave arrives. In practice, this means placing holding areas before concourse narrows, staggering gate opening times to spread arrival load, and using wave-release sequences at egress so all sections do not empty simultaneously. Physical barriers define these zones and provide psychological cues that guide fan behavior without constant staff intervention. The key is designing buffer zones on a to-scale plan so their dimensions are correct. A buffer zone that looks adequate on a non-scaled drawing may be dangerously undersized on the actual concourse.
What technology supports real-time crowd flow monitoring at stadiums in 2026?
Current stadium monitoring combines several layers. People-counting sensors and infrared counters sit at gates and concourse entry points. Wi-Fi and Bluetooth tracking use fans’ mobile devices to estimate density and dwell time across zones. CCTV analytics provide AI-powered density detection. Digital-twin platforms overlay live sensor data onto a virtual replica of the venue. The operational value comes from connecting these data feeds to a live plan that every team member, including operations, security, and medical, can see and act on simultaneously. OnePlan functions as that live plan. When a gate is redirected or a concourse is closed based on monitoring data, the update appears immediately for every stakeholder working in the same plan, which removes the lag that comes with radioing updates and hoping everyone acts on the same information.
How does OnePlan help stadium operations teams replace static PDFs and CAD files?
OnePlan lets teams import existing floor plans and site drawings, converted to .png format first, and scale them directly onto a live satellite map. Every object placed on the plan, including barriers, gates, staff positions, signage, and vehicle access routes, sits at its true dimension and stays to scale as you zoom. The result is a living plan that any team member can update in a browser without CAD software or specialist training. When a gate configuration changes, a concourse is temporarily closed, or a new staff position is added, the update is live for every collaborator immediately. Columbus Crew uses this approach to unite operations staff, contractors, and first responders on a single plan, saving 40% of planning time compared to their previous workflow.
Can OnePlan be used for both the inside of the stadium and the surrounding district?
Yes. OnePlan’s base layer is a live, zoomable satellite or street map, so the plan can cover the full footprint of a game-day operation, including parking lots, pedestrian approach routes, transport drop-off points, the stadium exterior, and the interior concourses and field level, all in one place. For multi-level venues, OnePlan supports planning across floors, with each level toggled on and off as needed. This means the same platform that maps your exterior traffic management and pedestrian corridors also holds your interior concourse layout, staff positions, and emergency vehicle routes. Every department, including operations, security, medical, and transport, works from a single source of truth rather than separate maps for each area.