
Written by: Paul Foster, Founder, CEO, OnePlan
Key Takeaways for Fair Capacity Planning
- Accurate crowd capacity calculations support fire-marshal permits and life-safety compliance at fairs and festivals.
- The five-step workflow, from site dimensions through documentation, produces defensible, permit-ready capacity figures.
- Live satellite mapping and to-scale objects replace outdated data and scattered files, which speeds up approvals.
- Zone-by-zone density planning reflects different crowd dynamics and prevents under- or over-estimating usable space.
- OnePlan automates these steps and exports print-ready documentation; book a demo to see how it streamlines your next fair.
Who This Crowd Capacity Guide Helps
This guide supports county-fair operations leads, parks-and-recreation staff, and small-festival organizers who must produce crowd capacity figures for fire-marshal permits and local-authority approvals. The same process applies to agricultural shows, community fairs, and multi-attraction outdoor festivals.
Requirements vary by locality, state, and event type. Treat everything here as illustrative guidance. Always verify your specific obligations with your local fire marshal, AHJ, and any applicable state or municipal code before submitting permit documentation.
You Don’t Need to Follow Every Step If You Use OnePlan’s Free Calculators
OnePlan offers two free calculators that handle the most calculation-heavy parts of the process. The arrival calculator estimates queue length and wait time for ticket checks and security screening. The exit calculator uses exit width, crowd size, and flow rate to estimate exit capacity. Both are free to use and require no account. If you need to build a full permit-ready capacity workflow from scratch, follow the five steps below.
Step 1: Gather Accurate Site Dimensions
Every later calculation depends on knowing the true boundary of your fairgrounds. Common inputs include the total site perimeter, the gross area in square feet, and the boundaries of any sub-zones such as the main arena, midway, livestock area, and parking.
A frequent pitfall is reliance on outdated satellite imagery or hand-measured sketches that miss recent construction, fencing changes, or new permanent structures. A live, zoomable satellite map gives you a current base layer. In OnePlan, the canvas is a geo-accurate satellite or street map built on leading GIS technology. You outline any area and the platform instantly returns its size in square feet, so you work from real dimensions rather than estimates.
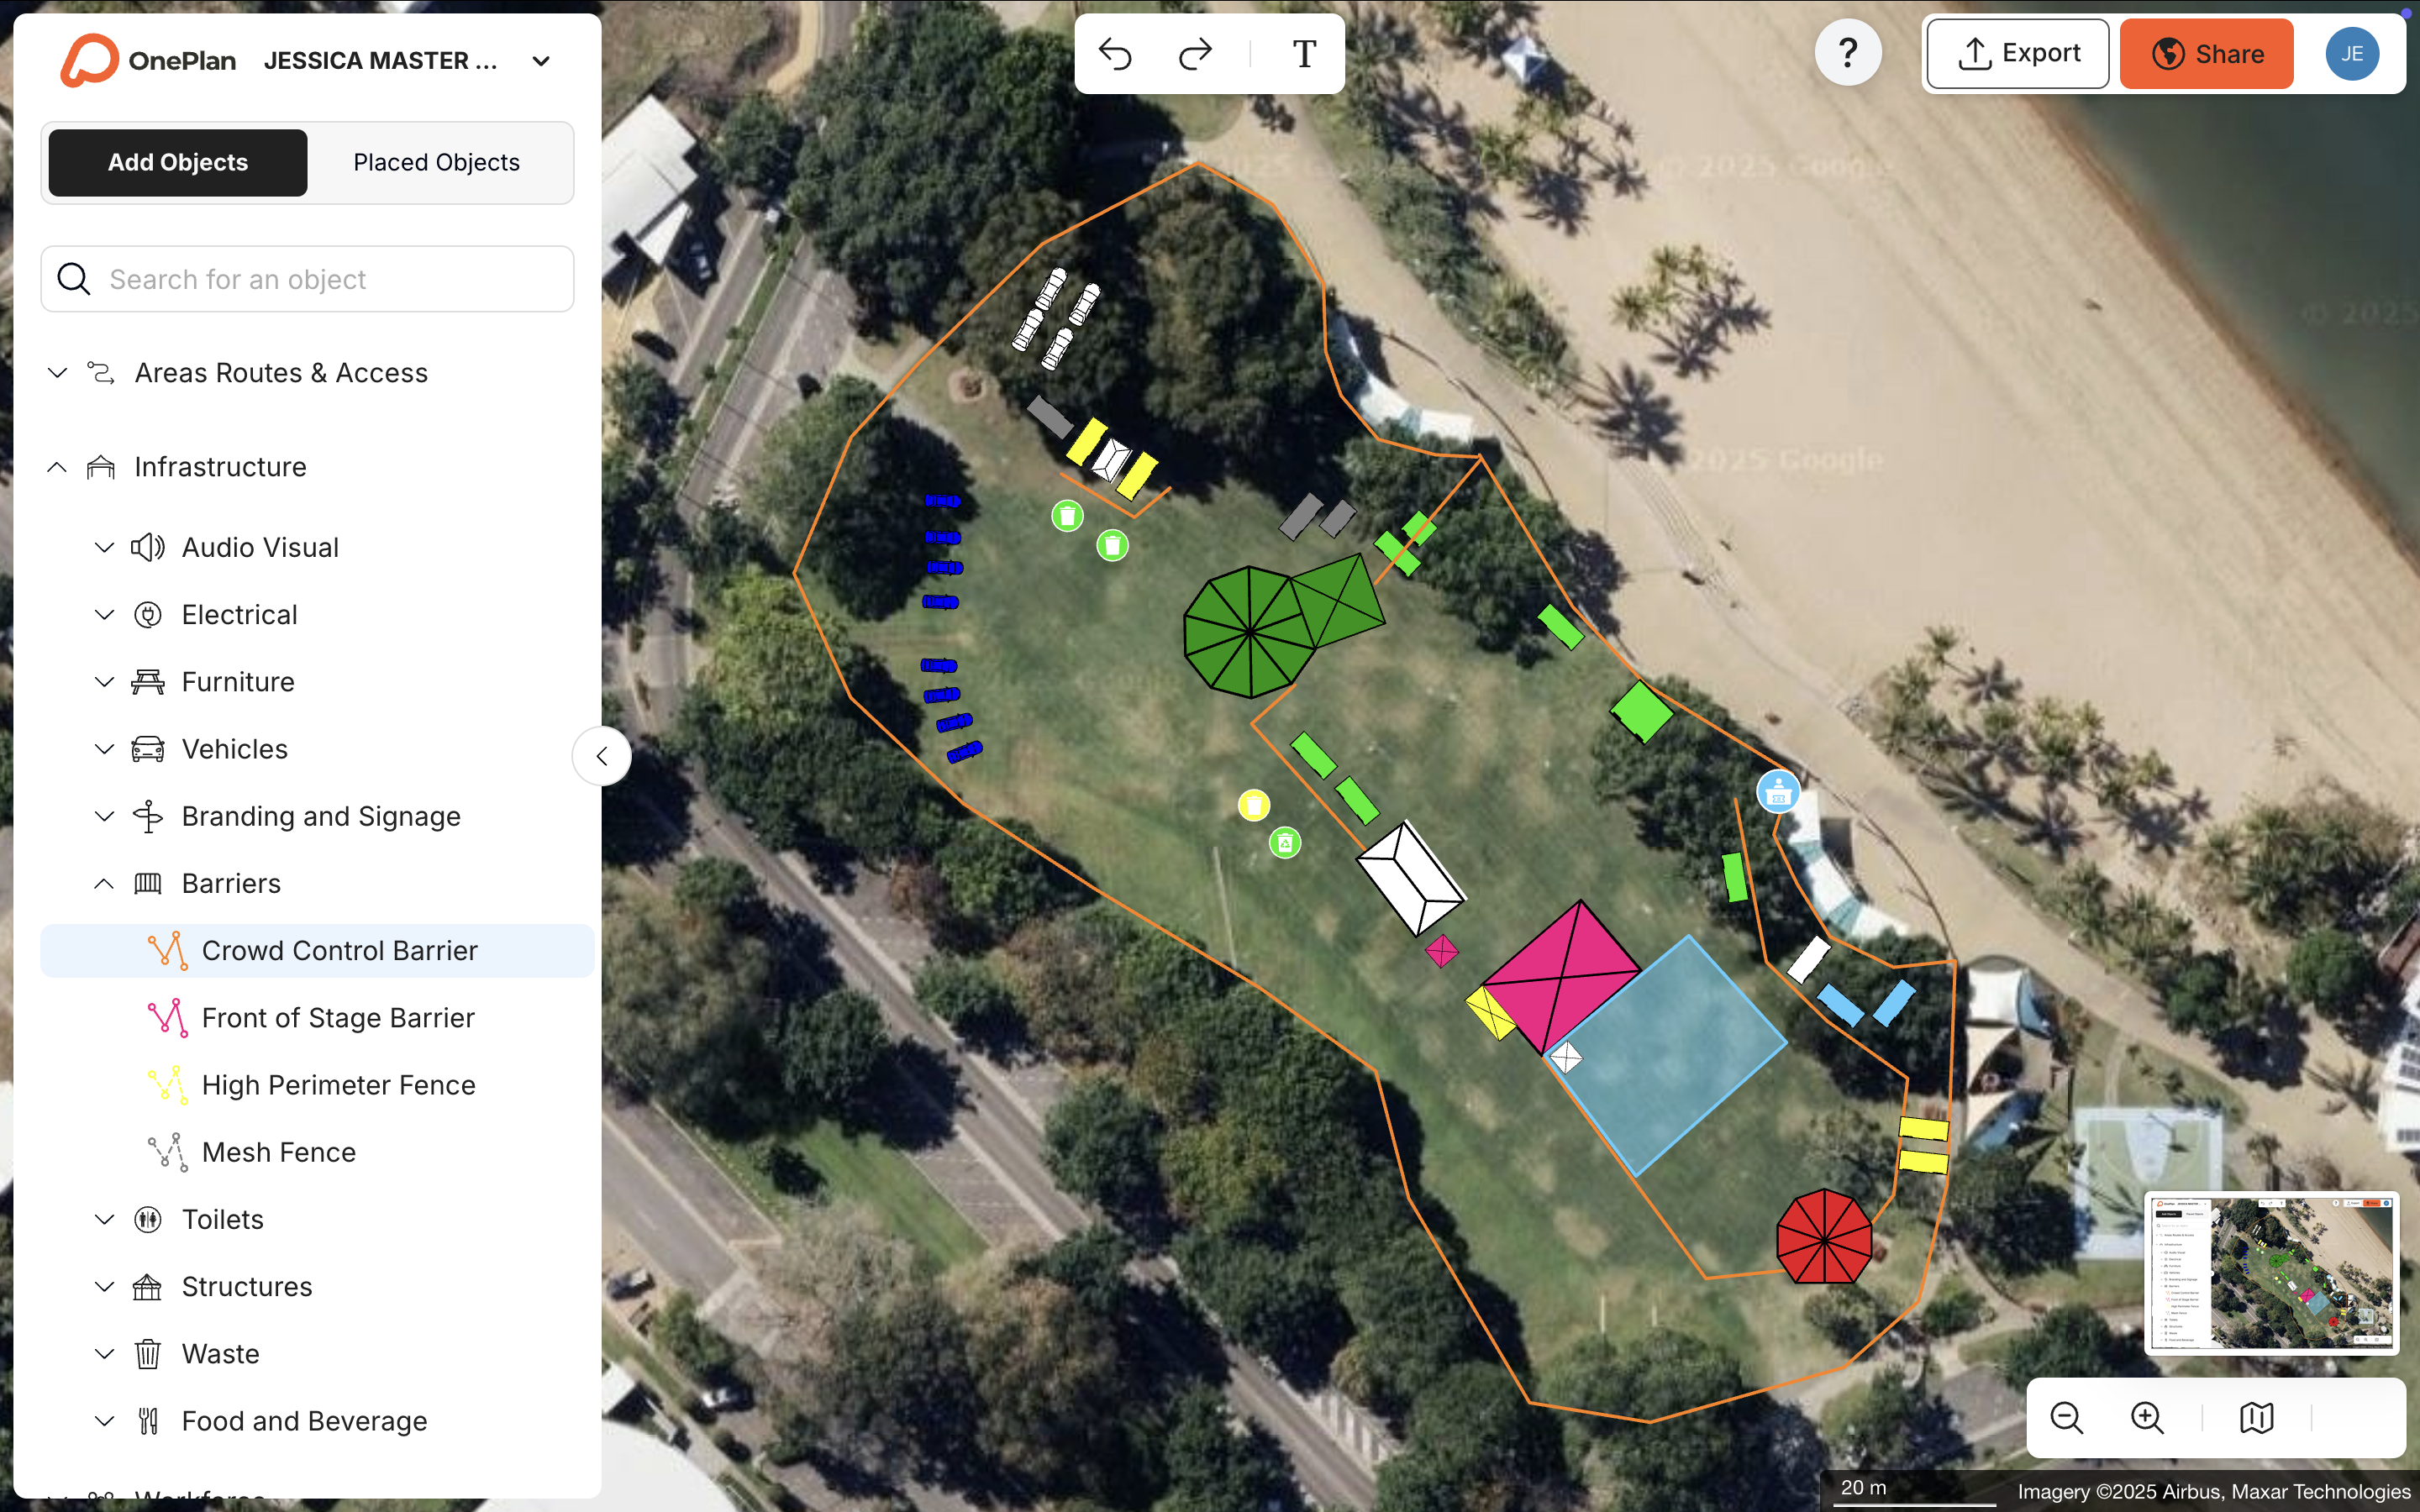
The output of Step 1 is a gross site area figure that feeds directly into Step 2.
Step 2: Subtract Non-Crowd Areas
Gross site area does not equal usable crowd area. Before any density calculation, subtract every space that attendees cannot or should not occupy:
- Stages and performance platforms, including the stage footprint and any production buffer zone
- Rides and attractions, including the ride envelope plus operator and safety clearance zones
- Vendor booths and food stalls, including booth footprint plus service queuing space
- Emergency access routes, including minimum clear-width corridors for emergency vehicles and evacuation
- Permanent structures such as buildings, restroom blocks, generator compounds, and first-aid stations
- Fencing, barriers, and buffer zones around restricted areas
A frequent mistake is underestimating how much space infrastructure consumes. Stalls and concessions can obstruct crowd movement and create congestion at outdoor events, so their footprints and the queuing space in front of them must be fully excluded from usable crowd area.
The result of Step 2 is a net usable area, broken down by zone.
Step 3: Apply Standing-Density Considerations by Zone
Different parts of a fairground support different crowd densities. A wide-open midway handles a different crowd dynamic than a tight corridor between vendor rows, and the area directly in front of a main stage behaves differently again. A zone-by-zone approach produces more accurate and more defensible figures than a single site-wide number.
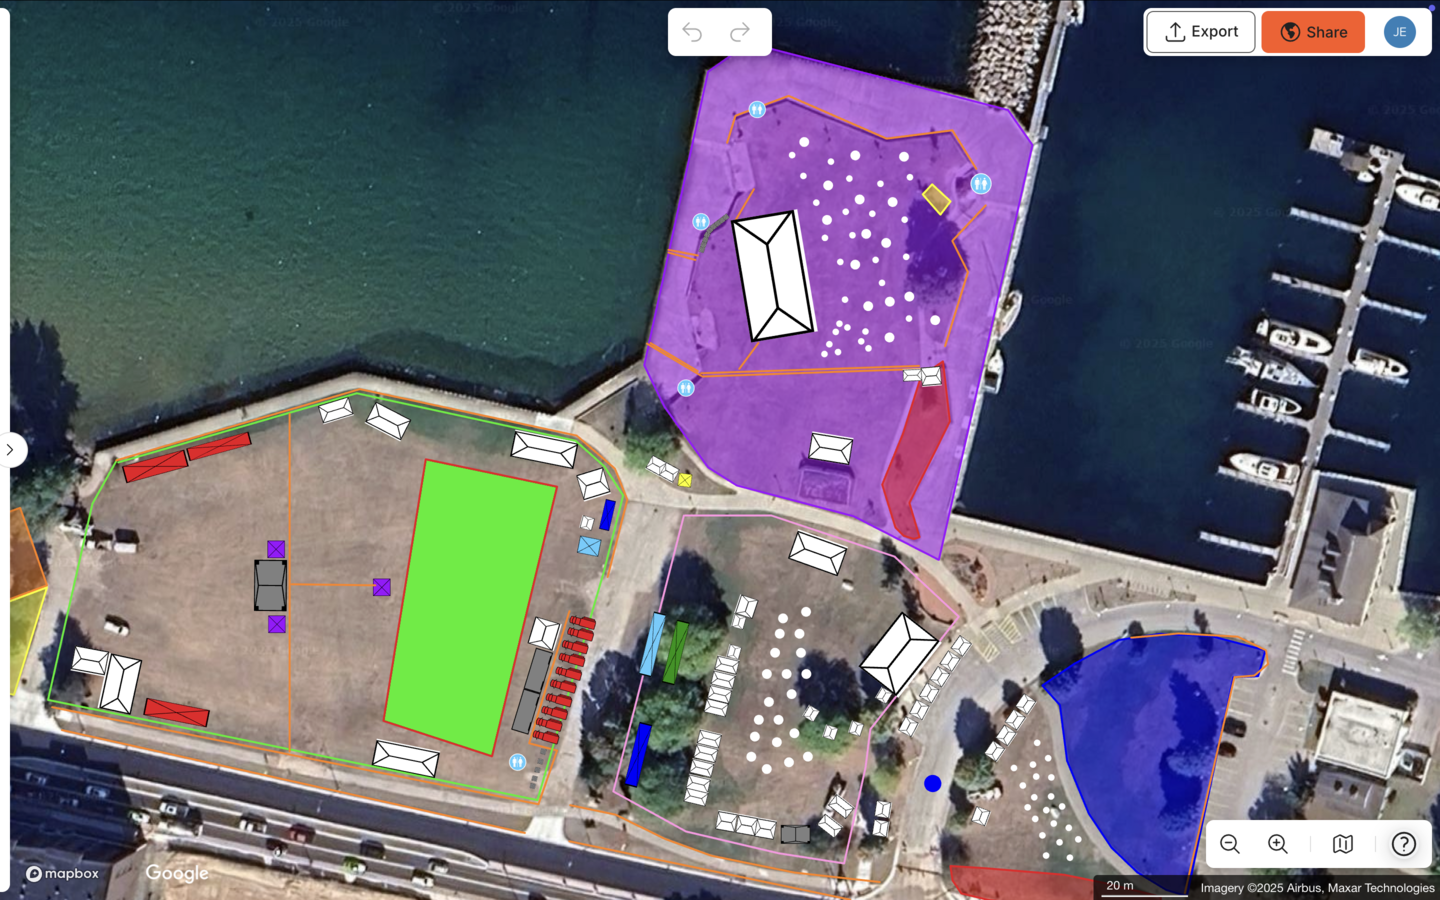
The table below illustrates typical fairground zones and the relative density considerations for each. No fixed attendees-per-square-foot benchmarks appear here, because your local fire marshal and AHJ set the permitted figures for your specific event and jurisdiction.
| Zone Type | Typical Characteristics | Density Consideration | Key Subtraction Items |
|---|---|---|---|
| Open crowd / main arena | Large, unobstructed grass or hardstand area | Higher relative density possible, still zone-limited by exits | Stage, production buffer, barrier lines |
| Midway / vendor corridor | Narrower pedestrian lanes between booths | Lower density, dynamic flow rather than static standing | Booth footprints, queuing space, service access |
| Rides and attractions zone | Fixed ride envelopes with operator areas | Minimal standing crowd, queue management critical | Ride envelope, safety clearance, queue lanes |
| Entry / exit plazas | High-flow transitional space | Lowest density, must remain clear for ingress and egress | Ticket gates, screening lanes, emergency routes |
Dynamic crowds at fairs and multi-attraction festivals create congestion from constant movement between areas, so static density figures alone do not give a complete picture. Zone boundaries, directional flow, and real-time monitoring all contribute to a complete crowd management strategy. Once you have identified your zones and their characteristics, you can convert those zone-specific considerations into actual capacity numbers.
Step 4: Run the Capacity Calculation
With net usable area per zone and authority-approved density figures in hand, you can apply a simple formula.
Zone Capacity = Net Usable Area (sq ft) ÷ Approved Density Factor (sq ft per person)
Sum the zone capacities to arrive at a total site capacity. For example, if your main arena has a net usable area of 20,000 sq ft and your fire marshal has approved a density of 5 sq ft per person for that zone, the zone capacity equals 4,000 people. Repeat this process for each zone and add the totals.
In OnePlan, you draw a crowd area on the map, select a standing density, and the platform calculates capacity instantly. This removes manual arithmetic and reduces formula errors. “The calculations for crowd capacity and parking areas are great. It’s nice to have a visual shape on our plan that shows me I can get 7,000 people at one person per square metre in there,” says Tom Newton, Director of Bearfoot Productions.
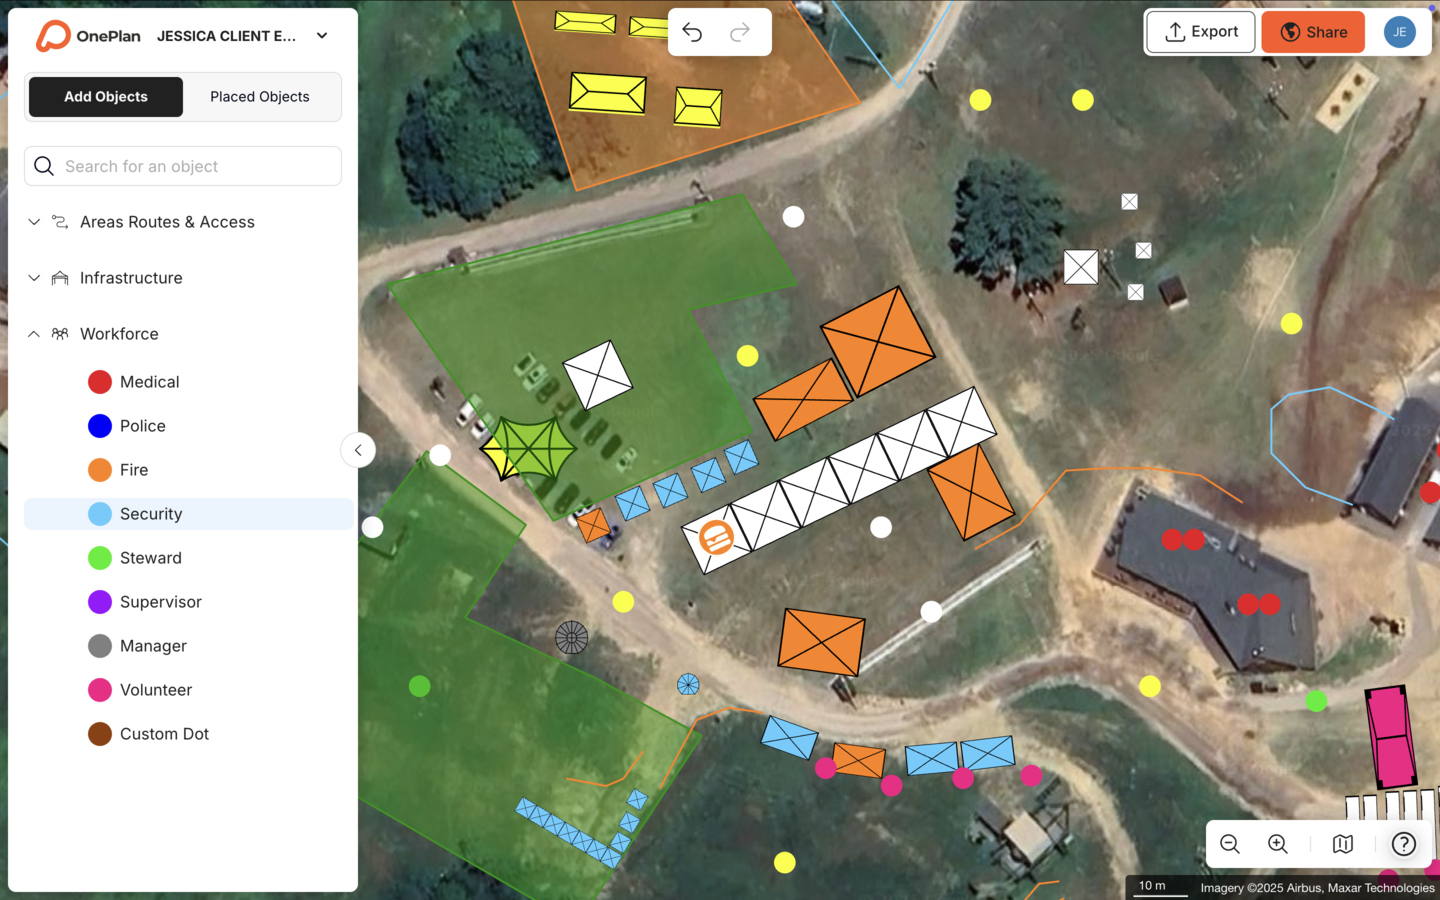
For arrival and exit flow, OnePlan offers free calculators. The arrival calculator estimates queue length and queue time for ticket checks and security screening. The exit calculator uses exit width, crowd size, and flow rate to estimate exit capacity. Both tools are free to use and require no account.
See how OnePlan automates these calculations, then book a demo or start your first event free.
Step 5: Document and Share Results for Approvals
A capacity number without documentation is not permit-ready. Your fire marshal needs to see how you arrived at the figure, including site dimensions, subtractions, zone breakdown, and density basis. A fire-marshal worksheet that mirrors the five steps above should include:
- Gross site area and source, including map reference and measurement date
- Itemized list of non-crowd subtractions with dimensions
- Net usable area per zone
- Density factor applied per zone and its authority basis
- Calculated capacity per zone and total site capacity
- Exit count and width verification against occupant load thresholds
Your exit verification should reference the applicable occupancy thresholds for your jurisdiction. For example, NFPA 101-2024 requires two exits above 500 occupants, three exits above 1,000 occupants, and four exits above a higher threshold. Your documentation must confirm compliance with whichever standard your fire marshal enforces.
In OnePlan, the same plan that generated your capacity figures exports as a high-resolution, print-ready map up to A0, alongside a Bill of Quantities report. The Cheese & Chilli Festival uses OnePlan’s crowd area measurement tools and evacuation calculators for risk assessments and management plans. The same approach works for any fair or outdoor festival.
Export print-ready documentation in seconds, get started free or schedule a 15-minute walkthrough.
Measuring Success from a Visual Capacity Workflow
A repeatable five-step process, documented in a single live plan, produces measurable operational improvements. Planners who move from spreadsheets and static screenshots to a visual, to-scale workflow often see fewer site visits, because dimensions are validated remotely before staff go on site. They also see faster permit approvals, because documentation is complete and consistent, and one shared map replaces multiple emailed versions circulating across departments.
The same visual calculation approach that validates capacity figures also reduces site visits. Newton’s team completed the design for a new 10,000-capacity festival with only two visits rather than weekly measuring sessions. “One of the features I like most right now is the crowd measurement feature. It’s so helpful to measure how many people you’re going to fit in a small area,” says Ehrabi Nael, Race Director of the Beirut Marathon, whose team cut roughly 20 annual site visits down to one or two.
Common Crowd Capacity Challenges and How to Reduce Risk
Outdated imagery. Satellite screenshots taken months or years ago can miss new permanent structures, fencing changes, and construction. OnePlan’s base layer uses a live, current satellite map. South Fayette Township’s Director of Parks and Recreation noted that “when I logged into OnePlan all the images were recently updated and all the new construction was there already.”
Version control chaos. When capacity figures live in emailed spreadsheets, different departments may act on different numbers. A single live plan in OnePlan means every stakeholder, including operations, fire, police, and medical, works from the same current document.
Underestimating usable space loss. Infrastructure consistently consumes more space than planners expect. Drawing each non-crowd element to scale on a map, rather than estimating in a spreadsheet, makes the subtractions visible and auditable before you submit the permit.
Frequently Asked Questions
How far in advance should I calculate crowd capacity for a fair?
Start as early as your site layout is reasonably stable, ideally at least 60 to 90 days before the event. This window gives you time to iterate if your fire marshal requests changes, adjust zone boundaries as vendor and ride placements are confirmed, and resubmit documentation without a last-minute scramble. If your fair runs annually, use your OnePlan site plan as a reusable template so next year’s calculation starts from a validated baseline rather than a blank map.
Does my local fire marshal set the density figures, or can I choose them?
In most U.S. jurisdictions, the authority having jurisdiction, typically your local fire marshal, sets or approves the density factors used in your occupancy calculation. National standards like NFPA 101 provide a framework, but local codes and the AHJ’s discretion govern what is actually permitted for your specific event. Always confirm the approved density basis with your fire marshal before finalizing your documentation.
Can I reuse my capacity calculations from one year to the next?
You can reuse prior calculations with verification. If your site layout, infrastructure footprint, and local code requirements have not changed, last year’s calculation provides a strong starting point. In OnePlan, your site plan carries forward as a living document. You update the elements that changed, such as a new stage position or an additional vendor row, and the capacity figures recalculate automatically. Always reconfirm with your fire marshal that the prior year’s approved figures still apply.
When should I move from a spreadsheet to a visual mapping tool?
The tipping point usually appears in one of three ways. Your fire marshal asks for a to-scale map alongside your capacity figures. Your site layout has enough zones and subtractions that spreadsheet errors become a real risk. Or you coordinate with multiple departments, such as operations, security, medical, and local authorities, who each need to see the same current plan. At that point, a visual, to-scale tool like OnePlan produces more defensible documentation and removes the version-control problem in one step.
Does OnePlan support seated capacity calculations for grandstands or bleachers?
OnePlan’s crowd capacity calculator focuses on standing crowd areas. If your fair includes grandstands or fixed seating, you will need to calculate seated capacity separately using your seating layout and confirm those figures with your fire marshal. OnePlan handles all the standing crowd zones, including open areas, midways, and stage viewing areas, where the five-step workflow above applies.
Turn Your Capacity Numbers Into a Live Site Plan
The five steps above work as a manual process. They work faster, more accurately, and with a fully shareable output when the same workflow runs inside OnePlan.
You start with a live satellite map of your fairgrounds, using current imagery that is accurate to scale. You draw your site boundary and OnePlan returns the gross area instantly. You place stages, rides, vendor booths, emergency routes, and restroom blocks as to-scale objects, and the platform shows you exactly how much space each one consumes.
You then draw crowd areas zone by zone, select your approved density, and capacity figures appear immediately. The finished plan exports as a high-resolution, print-ready map with a Bill of Quantities. Your fire marshal receives everything needed in one document, with no version-control risk because every stakeholder views the same live plan.
OnePlan has powered more than 200,000 events across 150 countries, from community fairs and county shows to the Paris 2024 Olympic Games. Your first event is free, with no payment details required, so you can start placing objects on your fairgrounds map within seconds.