
Written by: Paul Foster, Founder, CEO, OnePlan
Key Takeaways
-
Calculate venue capacity by dividing usable square footage, after subtracting obstructions, by the correct square-feet-per-person density for each zone.
-
Match density figures to the zone type (tight standing, comfortable standing, or circulation) and confirm them with local fire-code requirements instead of using gross square footage.
-
Apply a 10–15% comfort buffer to the raw headcount and cross-check the result against egress rules. The more restrictive figure sets the final planned capacity.
-
Document every step, including gross area, deductions, density per zone, raw counts, buffers, and final numbers, in a clear, permit-ready format with to-scale maps.
-
OnePlan lets you draw zones, subtract obstructions, assign densities, and generate permit-ready capacity figures instantly. See how OnePlan automates the entire workflow.
Standing-Room Density Reference Table
|
Zone Type |
Density (sq ft per person) |
Crowd Feel |
|---|---|---|
|
Tight standing (festival pit / main stage) |
~5 sq ft |
Shoulder-to-shoulder |
|
Comfortable standing (general admission) |
~8–10 sq ft |
Room to move |
|
Loose standing (vendor corridor / walkway) |
~10–15 sq ft |
Free movement |
|
Mixed-use / circulation buffer zone |
~15+ sq ft |
Relaxed flow |
Note: These ranges are illustrative. Always verify the applicable density standard with your local fire marshal or authority having jurisdiction, as requirements vary by state and venue type. The NFPA Life Safety Code establishes one person per seven square feet as the maximum safe standing density for concentrated assembly use without fixed seating, and once density exceeds that threshold, crowd crush risk increases significantly.
Step 1: Measure Total Square Footage from Satellite or Floor-Plan Data
Start with the gross footprint of your venue. For outdoor sites, use satellite imagery or a to-scale floor plan. For a practical example, take a general admission standing area with a gross footprint of 4,000 sq ft. That figure is your starting number, nothing more.
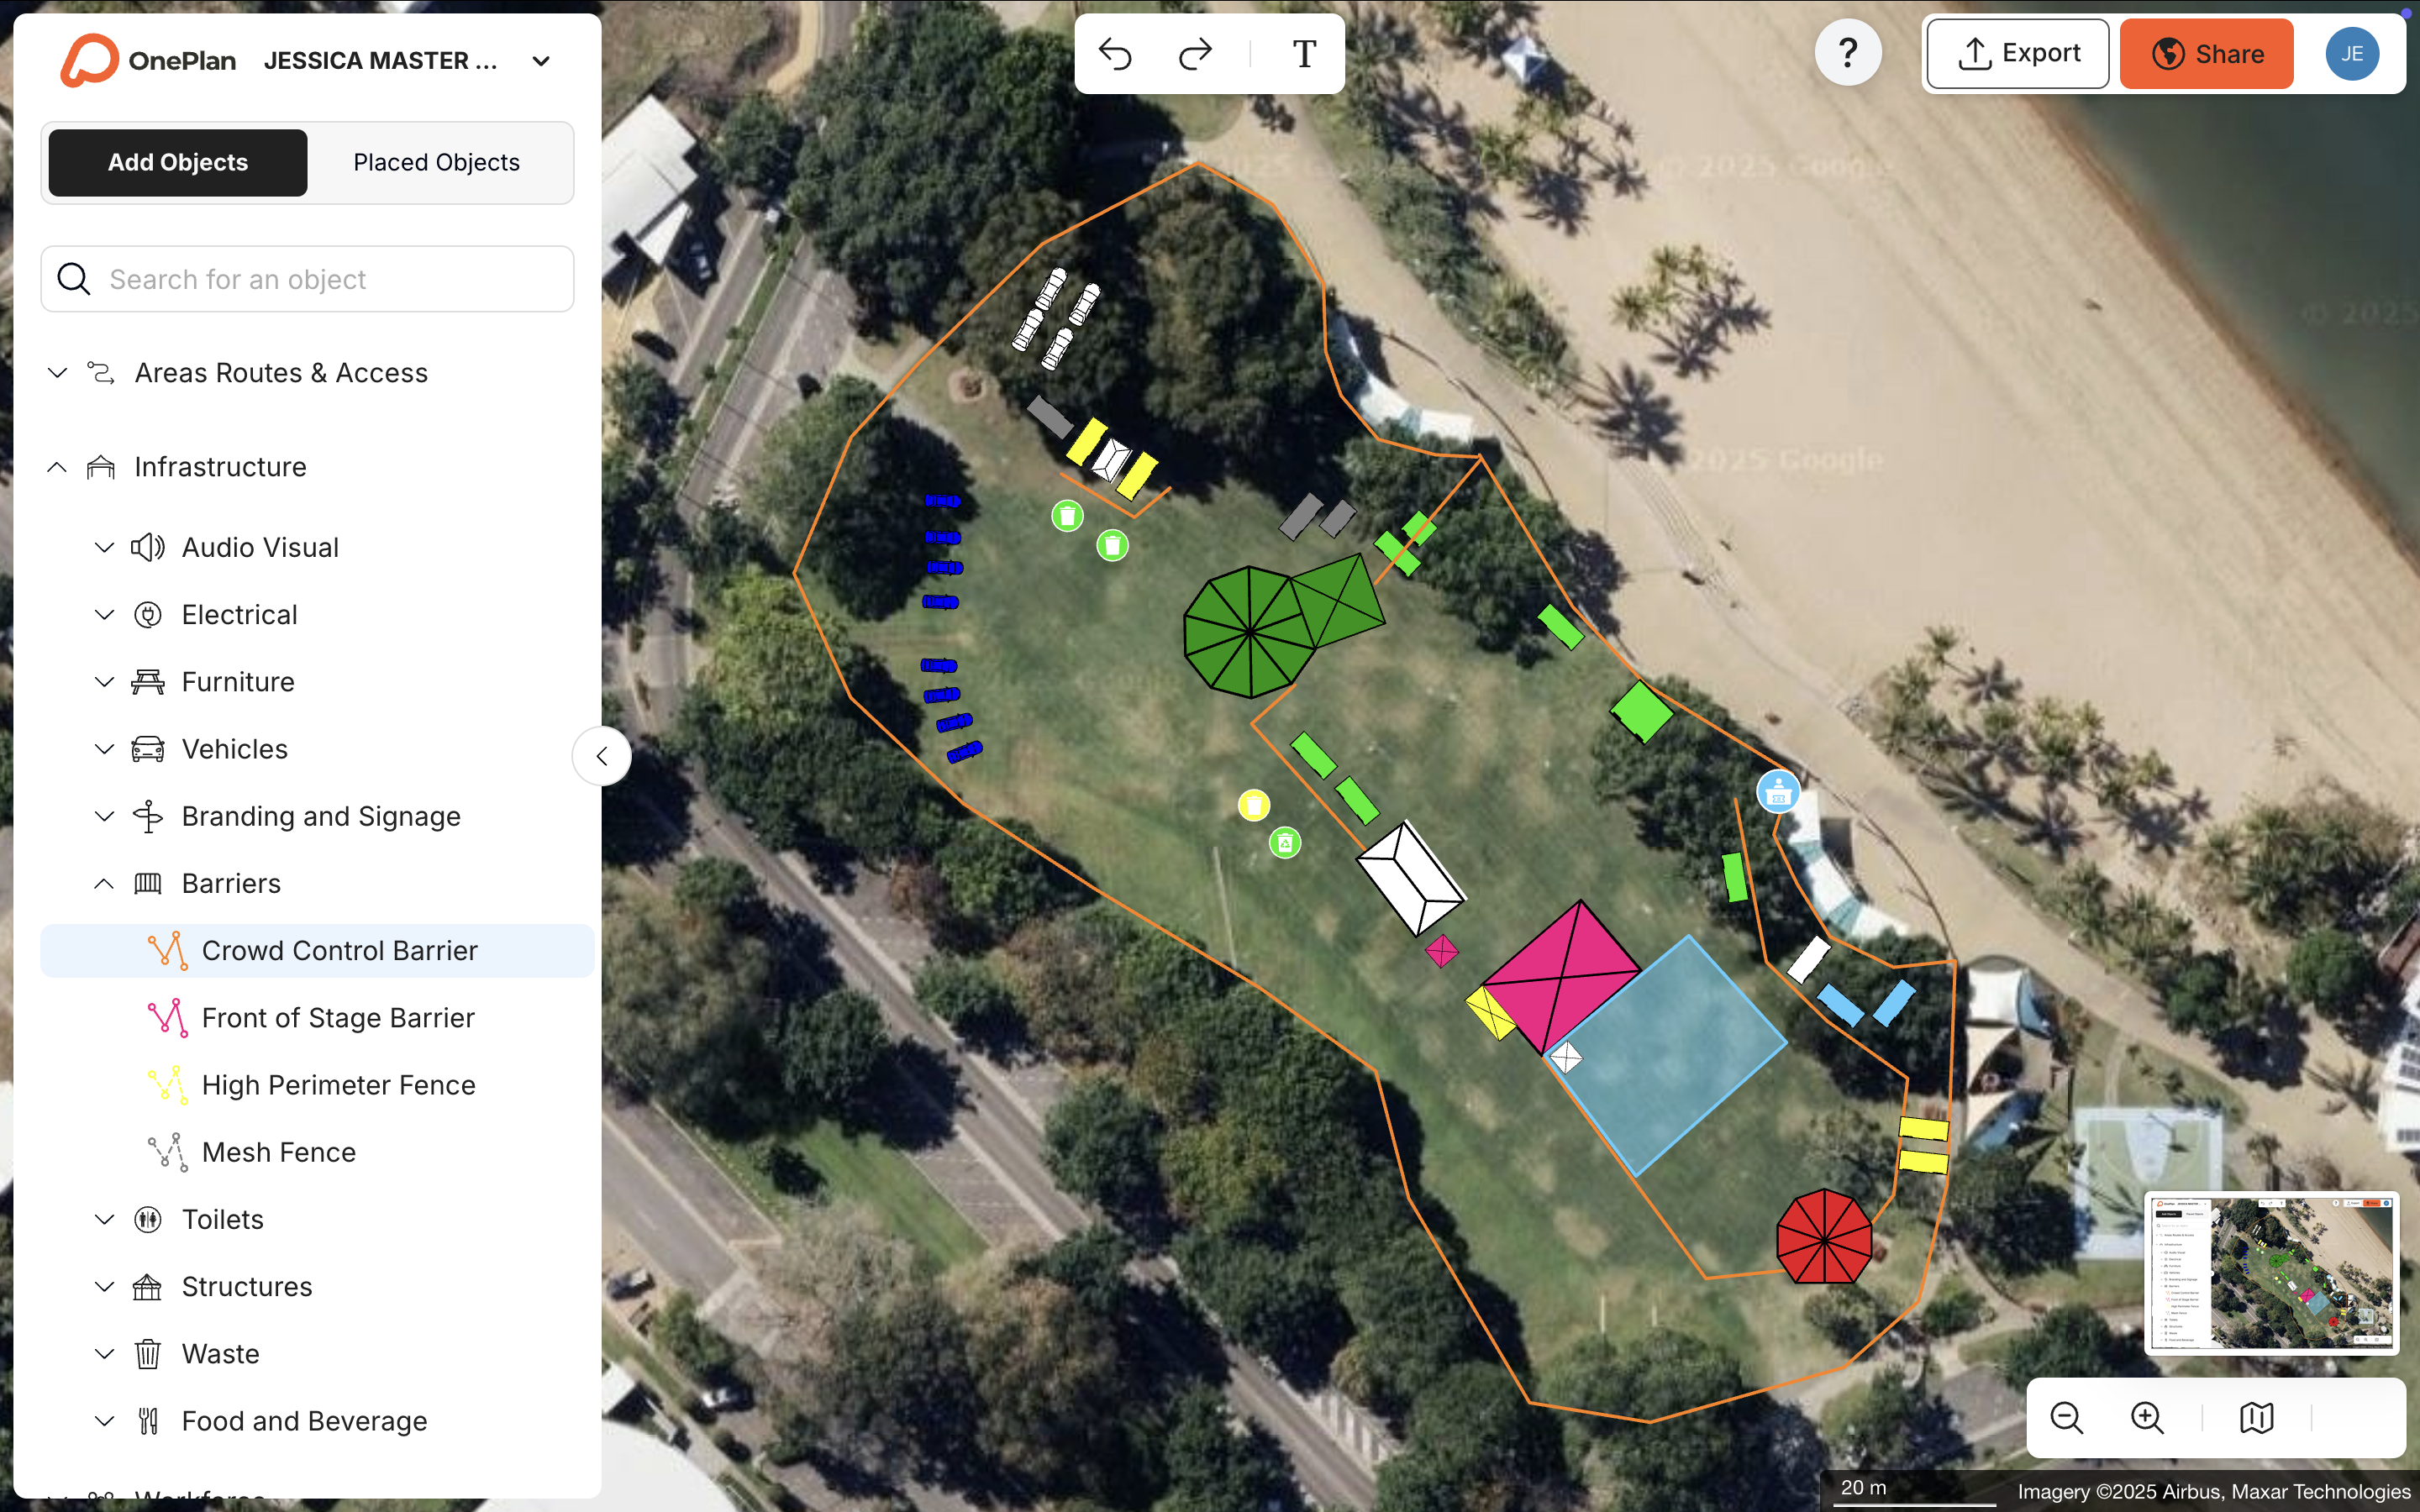
Manual tape-measure surveys take time and introduce errors. OnePlan’s area and perimeter calculator lets you outline any space on a live satellite map and returns the exact square footage instantly, without a single site visit.
Step 2: Subtract Fixed Obstructions to Reach Usable Square Footage
Remove fixed obstructions before you apply any density figure. Stage footprint, production risers, sound towers, barriers, service corridors, and structural columns all reduce usable space. In a 4,000 sq ft space, a 600 sq ft stage and 200 sq ft of production infrastructure leave 3,200 sq ft of usable floor area.
A defensible capacity plan must incorporate circulation space and buffer zones between high-density areas and moderate-density areas, rather than relying on gross square footage alone. Skipping this step is the most common reason capacity figures fail inspection.
Step 3: Select the Appropriate Standing Density for Each Zone Type
Different parts of the same venue operate at different densities. A main-stage pit runs tighter than a vendor corridor, and an entry plaza behaves differently from a circulation buffer.
As noted earlier, each zone requires its own calculation. A main-stage pit, vendor corridor, entry gate, and exit route each operate at different densities and must be assessed individually.
For the 3,200 sq ft usable general admission area in this example, a comfortable standing density of 8 sq ft per person fits the use. A tighter festival-pit zone would use a lower figure, while a vendor walkway would use a higher one. Refer to your local fire code for the applicable maximum in your jurisdiction.
Step 4: Divide Usable Square Footage by Density for Raw Headcount
Use simple arithmetic to convert area into people. In this example, 3,200 sq ft ÷ 8 sq ft per person equals 400 people as the raw headcount for that zone.
Repeat this calculation for every distinct zone in your venue, such as stage pit, general standing, vendor corridor, and entry plaza. Sum the results for a whole-site raw figure.
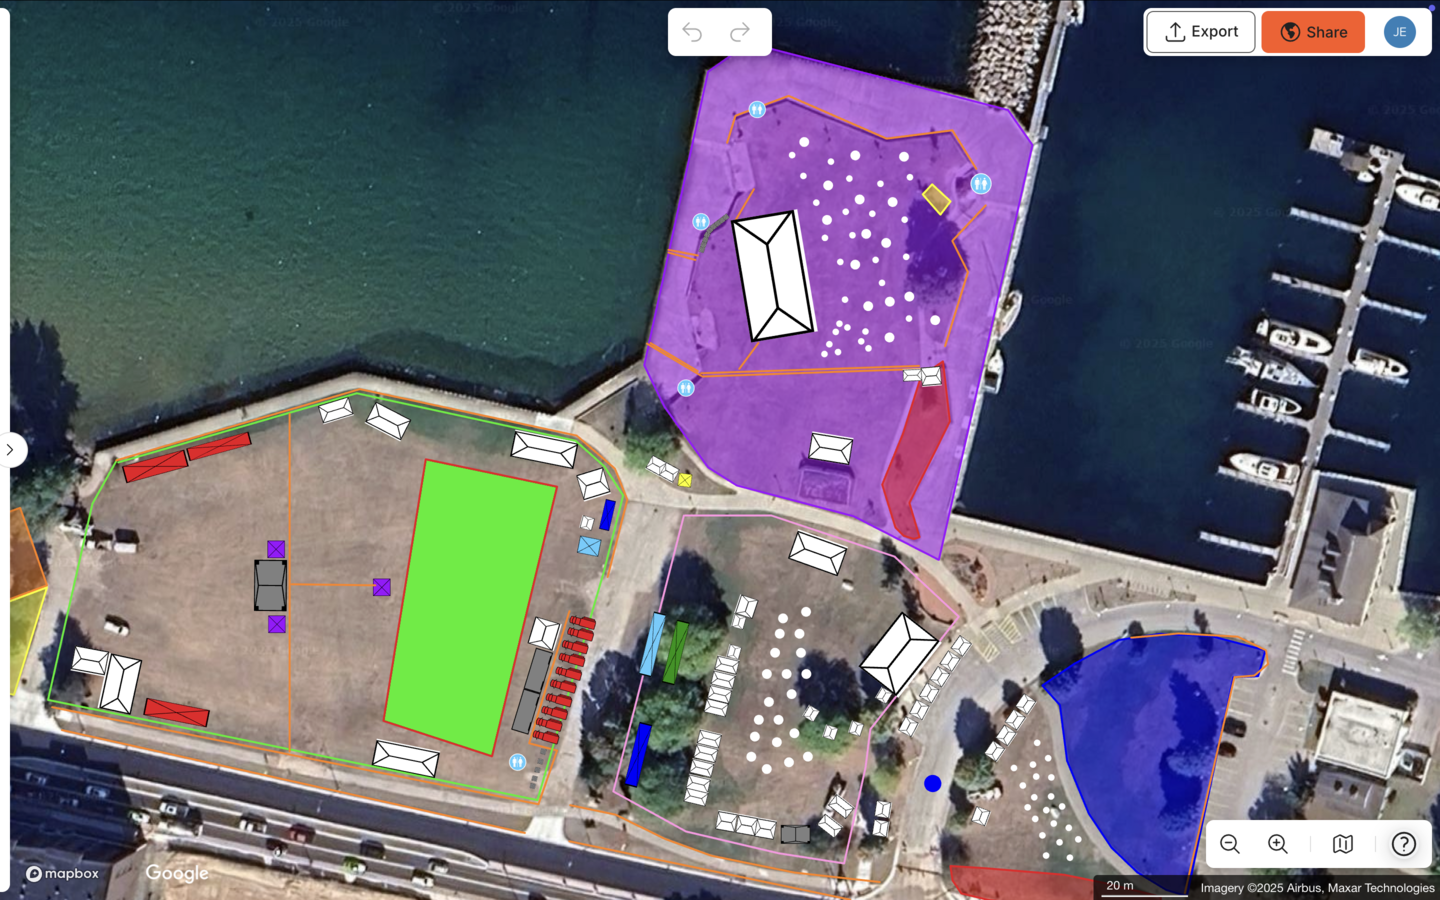
For multi-zone venues, keep these calculations in a single, visible plan. Spreadsheets stored in separate files make it easy to apply the wrong density to a zone or miss a zone entirely.
Step 5: Apply a 10–15% Comfort Buffer and Re-Check Against Local Fire-Code Egress Rules
Planned capacity should sit below the theoretical maximum so people can move freely and exit safely. A raw headcount calculated at maximum density leaves no margin for crowd movement, late arrivals, or emergency egress.
Apply a 10–15% reduction to your raw figure. For the 400-person example, a 12.5% buffer brings the planned capacity to 350 people. Then cross-check that number against your local fire code’s egress requirements, including exit width, travel distance, and door swing. The egress calculation may produce a lower ceiling than the density calculation, and the more restrictive figure governs.
Requirements vary by state, so always confirm them with the authority having jurisdiction in your location. Crowd density monitoring systems should set alert thresholds at 70% capacity (advisory), 85% (warning), and 95% (action required) at choke points such as main stage pits, entry gates, vendor corridors, and exit routes. Building those thresholds into your plan before event day gives your operations team clear triggers to act on.
For modeling how people arrive and exit against your final capacity figure, use OnePlan’s free arrival calculator and exit calculator to estimate queue length, queue time, and exit flow rate.
Step 6: Document Final Numbers and Export for Permitting
Clear documentation turns your calculations into a permit-ready capacity plan. Your permit submission should show gross square footage, deductions itemized by obstruction type, the density applied per zone, the raw headcount per zone, the buffer applied, and the final planned capacity.
Attach a to-scale site map that shows zone boundaries clearly. Authorities can then see how capacity, circulation, and egress work together on the ground.
OnePlan exports high-resolution maps, up to A0 and print-ready, and structured inventory reports directly from the plan. The numbers on the map and the numbers in the permit document always match.
Start planning your first event free, or schedule a quick walkthrough to see the platform in action.
Draw Your Layout Live and Calculate Capacity on the Map
OnePlan lets you complete every step above inside a single live map. Outline your venue on a satellite image, subtract obstructions by drawing them to scale, assign a density to each crowd zone, and read the capacity figure instantly.
Changes update in real time. When the stage footprint grows or a service corridor shifts, every zone recalculates automatically.
Try it now at calculators.oneplan.io. Draw your layout directly on the map and get a permit-ready capacity figure in minutes.
What Is the Formula for Calculating Venue Capacity?
The core formula is: Usable Square Footage ÷ Square Feet Per Person = Raw Headcount. Usable square footage equals gross area minus all fixed obstructions.
The density figure depends on zone type and local fire code. Apply a 10–15% comfort buffer to the raw headcount, then verify the result against egress requirements. The lower of the density-based figure and the egress-based figure is the defensible capacity for permitting.
While the formula itself is straightforward, applying it across multiple zones and keeping those calculations current throughout the planning cycle creates challenges, especially when teams rely on static tools.
When Spreadsheets Fall Short for Capacity Planning
Static spreadsheets create three recurring problems for capacity planning. First, version control becomes fragile. When the stage layout changes on Tuesday and the capacity spreadsheet is updated on Thursday, anyone working from Monday’s file uses wrong numbers.
Second, teams often repeat site visits. Without a to-scale map, planners drive out to re-measure every time a zone boundary shifts.
Third, spreadsheets provide weak zone visualization. A grid of numbers cannot show whether a 350-person crowd zone actually fits around the production infrastructure or whether the egress route is wide enough.
In OnePlan’s 2026 Event Site Planning Report, over one in three event professionals named crowd safety and flow as their single biggest planning challenge, and 44% said accurate measurements and layouts are critical to success. Spreadsheets address neither problem at the speed modern permitting timelines demand.
Ehrabi Nael, Race Director of the Beirut Marathon, an event with 49,000 participants, put it directly: “One of the features I like most right now is the crowd measurement feature. It’s so helpful to measure how many people you’re going to fit in a small area.”
Real-World Example: Eagle Mountain City Cuts Planning Time
Eagle Mountain City, Utah, previously built separate maps for fire, police, facilities, and other departments. That process took 8–10 hours per event and created version-control problems across every stakeholder group.
After switching to OnePlan, Events Manager Dawn Hancock’s team builds one comprehensive, to-scale map of the entire event site and shares it across departments. The result was a 70% time saving and an estimated 5x ROI.
Capacity zones, egress routes, and infrastructure placements all live in one plan, so permit submissions reflect the actual layout every time.
Tom Newton of Bearfoot Productions, which plans festivals up to 10,000 capacity, describes the same workflow. “The calculations for crowd capacity and parking areas are great. It’s nice to have a visual shape on our plan that shows me I can get 7,000 people at one person per square metre in there.”
Want to see multi-zone capacity planning in your own venue? We will show you in 15 minutes.
Frequently Asked Questions
Does fire code vary by state, and how does that affect my capacity calculation?
Fire code varies significantly by state and municipality, and that variation directly affects capacity calculations. While the NFPA Life Safety Code provides a widely referenced national baseline for standing density, individual states and municipalities adopt, amend, or supplement those standards independently.
California, New York, Texas, and Florida each have their own fire code provisions that may set stricter maximums or require additional egress calculations. Always confirm the applicable standard with the authority having jurisdiction in your specific location, typically the local fire marshal, before finalizing any capacity figure for a permit submission.
How is standing capacity different from seated capacity?
Standing and seated configurations use different density assumptions and produce very different headcounts for the same footprint. Seated arrangements allocate more space per person to account for chair dimensions and row spacing, which means a seated layout will always yield a lower headcount than a standing one for the same usable area.
OnePlan’s crowd capacity calculator is designed for standing crowd calculations. For seated configurations, consult your venue’s fixed-seating manifest or work with a specialist seating planner.
How often should I re-measure and recalculate capacity?
Recalculate capacity whenever the physical layout changes. Stage size, production infrastructure, barrier configuration, or zone boundaries all affect usable space and density.
For recurring annual events, treat the previous year’s plan as a starting point, not a final answer. Site conditions, permit requirements, and infrastructure footprints often shift year to year.
OnePlan’s live map updates capacity figures automatically as you adjust zone boundaries, so recalculation becomes continuous rather than a separate manual step.
How do I handle a venue with multiple zones at different densities?
Handle multi-zone venues by calculating each zone independently. Measure usable square footage per zone, apply the appropriate density for that zone type, derive a raw headcount, apply your buffer, and check against egress rules.
Sum the zone totals for a whole-site figure, but keep the per-zone breakdown in your permit documentation. Authorities will want to see that each area has been assessed individually, not just the aggregate.
OnePlan lets you draw and label each zone separately on the same map, so the per-zone and whole-site figures stay visible together.
What export formats does OnePlan support for permit submissions?
OnePlan exports high-resolution PNG maps, up to A0 and print-ready, and structured inventory reports in Excel or CSV format. The map export includes a legend, and the inventory report lists every object placed on the plan, including crowd zones, barriers, infrastructure, and staff positions, as a structured Bill of Quantities.
Both outputs are designed to drop directly into permit applications and contractor briefings without reformatting.
When should I involve local authorities in the capacity calculation process?
Involve your local fire marshal, building department, or relevant authority as early as possible. Early engagement usually works best before you finalize zone boundaries, not after.
In many U.S. jurisdictions, a pre-application meeting with the fire marshal is standard practice for events above a certain attendance threshold, though that threshold varies by location. Bringing a to-scale site map with preliminary zone calculations to that meeting gives authorities something concrete to review and significantly reduces the number of revision cycles before approval.